CRUDE OIL Move Down Ahead! Sell!
Hello,Traders!
USOIL was making a
Bullish correction but
It is in the downtrend
Overall, so as the price
Is hovering beneath the
Horizontal resistance
Of 64.80$ from where
We will be expecting a
Local bearish correction
Sell!
Comment and subscribe to help us grow!
Check out other forecasts below too!
Disclosure: I am part of Trade Nation's Influencer program and receive a monthly fee for using their TradingView charts in my analysis.
OIL_CRUDE trade ideas

Crude Oil | Support Level 62.700-61.700Crude Oil reached support level.
Take Profit : 71.750
Stop Loss : 60.680

Rising Wedge and Triple topThe price has broken out of the rising wedge pattern followed by a pullback that has formed a triple top on the 1-hour timeframe, if the price makes a lower low, we will see a bearish impulse
WE ONLY TRADE PULLBACKS

USOIL: Bearish Forecast & Outlook
The recent price action on the USOIL pair was keeping me on the fence, however, my bias is slowly but surely changing into the bearish one and I think we will see the price go down.
Disclosure: I am part of Trade Nation's Influencer program and receive a monthly fee for using their TradingView charts in my analysis.
❤️ Please, support our work with like & comment! ❤️

Buy Opportunity🛢️ WTI Crude Oil (4H) – Bullish Reversal Setup
WTI has hit a significant support zone near $59.30, aligning with a previous demand area and low-volume node from earlier consolidation. Price action suggests potential exhaustion in the selling momentum as indicated by the histogram flattening.
🟢 Entry: $59.32
🎯 Target: $64.69 – Previous swing high and key supply level
🛑 Stop Loss: $57.32
📊 Risk/Reward Ratio: 2.79
📆 Target Date: May 6, 2025
📈 Projected Move: +9.06% / +$5.37
🔍 Key Observations:
Strong support area with prior reaction.
Price now trading at low end of value zone (yellow-blue volume profile), often signaling reaccumulation.
Histogram shows bearish momentum waning – potential for shift in trend.
A move above $61.83 could accelerate bullish continuation.
📌 Bias: Bullish – Buy the dip with confirmation above $60 for safer entry.

OIL sell setup H1Hello! Friends,
Greetings. Please leave a Like if you like the idea.
Before start talking about technical Let's share your LOVE by giving me LIKES to support this work. Thanks in advance.

OilusdEASYMARKETS:OILUSD
This wave analysis is one of many possible scenarios and is not a recommendation to buy or sell

USOIL SPOT CASH ANALYSIS Oil Analysis:
Overall Trend: The general trend remains bearish, moving towards key supportive correction zones aligned with Fibonacci retracement levels.
Technical Signals:
A regular hidden positive divergence has appeared, suggesting a potential upward movement from the corrective Fibonacci levels.
Outlook:
Based on the current setup, there are expectations for a bullish rebound from the corrective zones toward higher target areas, as illustrated in the accompanying chart.


WTI Oil H4 | Bearish reversal off an overlap resistance?WTI oil (USOIL) is rising towards an overlap resistance and could potentially reverse off this level to drop lower.
Sell entry is at 62.04 which is an overlap resistance.
Stop loss is at 64.95 which is a level that sits above a multi-swing-high resistance.
Take profit is at 59.18 which is a swing-low support that aligns close to a 61.8% Fibonacci retracement.
High Risk Investment Warning
Trading Forex/CFDs on margin carries a high level of risk and may not be suitable for all investors. Leverage can work against you.
Stratos Markets Limited (tradu.com):
CFDs are complex instruments and come with a high risk of losing money rapidly due to leverage. 63% of retail investor accounts lose money when trading CFDs with this provider. You should consider whether you understand how CFDs work and whether you can afford to take the high risk of losing your money.
Stratos Europe Ltd (tradu.com):
CFDs are complex instruments and come with a high risk of losing money rapidly due to leverage. 63% of retail investor accounts lose money when trading CFDs with this provider. You should consider whether you understand how CFDs work and whether you can afford to take the high risk of losing your money.
Stratos Global LLC (tradu.com):
Losses can exceed deposits.
Please be advised that the information presented on TradingView is provided to Tradu (‘Company’, ‘we’) by a third-party provider (‘TFA Global Pte Ltd’). Please be reminded that you are solely responsible for the trading decisions on your account. There is a very high degree of risk involved in trading. Any information and/or content is intended entirely for research, educational and informational purposes only and does not constitute investment or consultation advice or investment strategy. The information is not tailored to the investment needs of any specific person and therefore does not involve a consideration of any of the investment objectives, financial situation or needs of any viewer that may receive it. Kindly also note that past performance is not a reliable indicator of future results. Actual results may differ materially from those anticipated in forward-looking or past performance statements. We assume no liability as to the accuracy or completeness of any of the information and/or content provided herein and the Company cannot be held responsible for any omission, mistake nor for any loss or damage including without limitation to any loss of profit which may arise from reliance on any information supplied by TFA Global Pte Ltd.
The speaker(s) is neither an employee, agent nor representative of Tradu and is therefore acting independently. The opinions given are their own, constitute general market commentary, and do not constitute the opinion or advice of Tradu or any form of personal or investment advice. Tradu neither endorses nor guarantees offerings of third-party speakers, nor is Tradu responsible for the content, veracity or opinions of third-party speakers, presenters or participants.

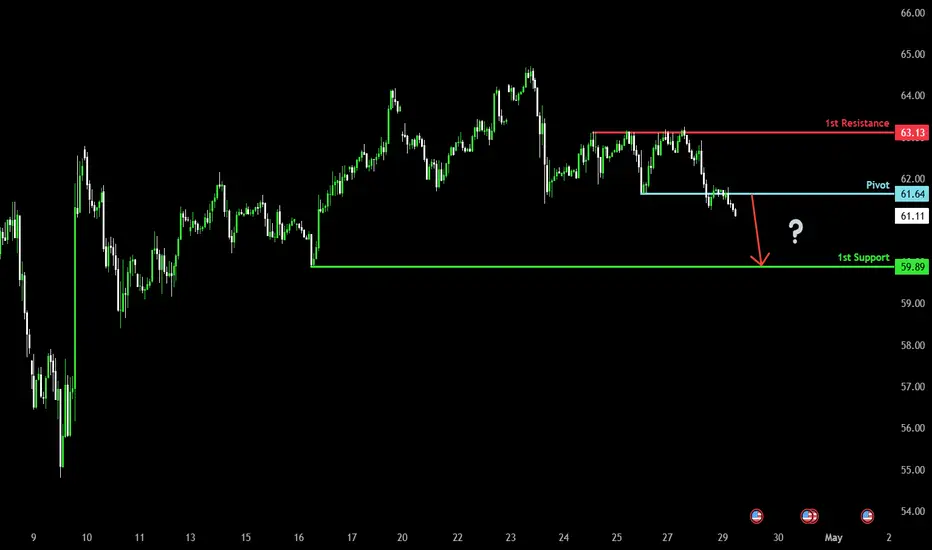
Bearish drop off pullback resistance?WTI Oil (XTI/USD) has rejected off the pivot which is a pullback resistance and could drop to the pullback support.
Pivot: 61.64
1st Support: 59.89
1st Resistance: 63.13
Risk Warning:
Trading Forex and CFDs carries a high level of risk to your capital and you should only trade with money you can afford to lose. Trading Forex and CFDs may not be suitable for all investors, so please ensure that you fully understand the risks involved and seek independent advice if necessary.
Disclaimer:
The above opinions given constitute general market commentary, and do not constitute the opinion or advice of IC Markets or any form of personal or investment advice.
Any opinions, news, research, analyses, prices, other information, or links to third-party sites contained on this website are provided on an "as-is" basis, are intended only to be informative, is not an advice nor a recommendation, nor research, or a record of our trading prices, or an offer of, or solicitation for a transaction in any financial instrument and thus should not be treated as such. The information provided does not involve any specific investment objectives, financial situation and needs of any specific person who may receive it. Please be aware, that past performance is not a reliable indicator of future performance and/or results. Past Performance or Forward-looking scenarios based upon the reasonable beliefs of the third-party provider are not a guarantee of future performance. Actual results may differ materially from those anticipated in forward-looking or past performance statements. IC Markets makes no representation or warranty and assumes no liability as to the accuracy or completeness of the information provided, nor any loss arising from any investment based on a recommendation, forecast or any information supplied by any third-party.
OIL sell setup H1Hello! Friends,
Greetings. Please leave a Like if you like the idea.
Before start talking about technical Let's share your LOVE by giving me LIKES to support this work. Thanks in advance.

USOIL Long Idea#USOIL
Under current market conditions, the area near 62.28 has been identified as a critical support zone, where the AI model detects a high-probability trade setup.
From a technical perspective, a clear directional bias based on recent price action patterns. If the market demonstrates increased volume and price stability above key moving averages in the 62.28 area, traders are advised to monitor for trend-continuation entry opportunities in alignment with the prevailing momentum.
Profit targets are defined at 63.67 and 64.86, corresponding to logical technical resistance zones. These levels are designed for staged profit-taking across different trade management styles. Stop-loss should be strictly enforced at the designated level; once breached, the strategy is considered invalidated in order to limit potential downside.

#USOIL 4HUSOIL (4H Timeframe) Analysis
Market Structure:
The chart is forming a classic Head and Shoulders pattern, which often signals a potential reversal from an uptrend to a downtrend. The left shoulder, head, and right shoulder are clearly visible, and the neckline is an important support zone to monitor.
Forecast:
A sell opportunity may be considered if the price breaks and closes below the neckline with confirmation. This breakdown could indicate the start of a bearish trend continuation.
Key Levels to Watch:
- Entry Zone: Look for a sell setup once the neckline is broken and retested as resistance.
- Risk Management:
- Stop Loss: Positioned above the right shoulder to minimize risk.
- Take Profit: Target nearby support zones or use a measured move technique based on the pattern's height.
Market Sentiment:
As long as the neckline holds and the breakdown is confirmed, bearish momentum is likely. A failure to break below the neckline would delay or invalidate the selling setup.

Crude OilU.S Oil Index
- Bullish Channel as an corrective pattern in Short Time Frame
- Break of Structure
- Fibonacci Level - 61.80%
- Head and Shoulder
- Completed Impulse and Corrective Waves " AB "

Bullish on USOILAs the chart shows, in the 1 - hour timeframe, USOIL is in an upward - trending channel 📈. The price fluctuates upwards between two trendlines. Despite pullbacks, the uptrend persists, suggesting short - term bullish dominance. Still, the frequent swings reveal ongoing bull - bear market battles.📈
⚡⚡⚡ USOIL ⚡⚡⚡
🚀 Buy@61.5 - 62.0
🚀 TP 63.5 - 65.0
Accurate signals are updated every day 📈 If you encounter any problems during trading, these signals can serve as your reliable guide 🧭 Feel free to refer to them! I sincerely hope they'll be of great help to you 🌟

USOIL Opening Trends and Trading Strategies Next WeekTrend Analysis
As shown in the chart, in the 1 - hour time frame, USOIL is moving within an upward - trending channel 📈. This channel is defined by two trendlines, and the price is fluctuating upwards within it. Although there have been pullback trends during this period, the overall trend remains upward. This indicates that in the short term, the bullish forces are relatively dominant, driving the price to gradually climb 📈. However, the frequent price fluctuations also reflect a certain degree of game - playing between the bulls and bears in the market 🤺.
⚡⚡⚡ USOIL ⚡⚡⚡
🚀 Buy@61.5 - 62.0
🚀 TP 63.5 - 65.0
Accurate signals are updated every day 📈 If you encounter any problems during trading, these signals can serve as your reliable guide 🧭 Feel free to refer to them! I sincerely hope they'll be of great help to you 🌟

USOIL Potential UpsidesHey Traders, in today's trading session we are monitoring USOIL for a buying opportunity around 60.80 zone, USOIL is trading in an uptrend and currently is in a correction phase in which it is approaching the trend at 60.80 support and resistance area.
Trade safe, Joe.


WTI: B- tradeA page from my trading journal. Please take it with a grain of salt, as I’m still learning and growing 🌟
Bias balance
• Short (Fade 64.50)
– Risk: Small SL (tight)
– Reward: 3–4 points
– Probability: High
– Setup Grade: B
• Long (Breakout > 64.50)
– Risk: Moderate
– Reward: 3–5 points
– Probability: Medium
– Setup Grade: B-

Concerns about demand limit the upside potentialCrude oil lacks upward momentum, with the target pointing to $60.
USOIL
sell@62.8-63.3
tp:61.5-61
I hope this strategy will be helpful to you.
When you find yourself in a difficult situation and at a loss in trading, don't face it alone. Please get in touch with me. I'm always ready to fight side by side with you, avoid risks, and embark on a new journey towards stable profits.

Head and shoulder - sellThis is a possible head and shoulder pattern, one neckline is broken and price is creating another shoulder aka pullback before heading down in a reversal after price attempted to push up.

USOIL ANALYSISHello friends
Everything is clear on the chart for you, our probability is price growth to the specified areas.
Be sure to observe risk and capital management.
*Trade safely with us*
