NEW RECORD HIGH Coming 26 td from today The wave structure I was so bearish on Has made it to the support targets the crash cycle based on data back to 1902 is all Crash cycles have been 8 to 12 TD today is day 9 I have moved to a 90 long knowing that the cycle has at most 2 days and is into the 5 /6 spiral cycle lows inan event due by 3/8 to 3/13 focus 3/10 .I can now state that the chart posted could be counted as an expanding triangle in what is now labeled wave 4 I am looking for a sharp 26 td rally to mark the top from 3/10the week .SP 100 should see 3055 min to as high 3150 in a blowoff wave . Best of trades WAVETIMER
OEX trade ideas

OEX 100 hourly Forecast 3273I am posting this chart for a guide as to where if we still need to go to complete the advance ! best of trades the Wavetimer

OEX 100 FINAL LEG TARGET 3273 March 13th week The chart posted is the blue chips SP 100 OEX .It is my View that All markets are that of fractals patterns the have a clear movement of math in a repeating Sequence . March 13th week if I am correct and we are into an OEX HIGH near 3273 we would be hitting the long term channel as well as my 1.4 to 3.4 % Breach of the monthly Bollinger band signal as well . I would then generate My Signal for the Major Top to End the bull move from march 9 2009 . I have posted the forecast for 2025 calling for a min drop of 20 % plus as I did in the bed8th forecast 2021 calling for a decline of mIn 20 plus . Well spirals as well as the Math and Bullish Sentiment models call a last wave up in what should be a blowoff ?? in a narrow but it is a new Paradigm !! The MIN decline in this signal has been 21.9 The avg has been 38% and the longest has been over 50 % . If we see a sharp drop over the next 3 td and we drop to 618 target 2886 plus or minus 4 I will move to a 120% long in the money Calls in SPY and QQQ . Best of Trades WAVETIMER After this top I will turn as Bearish as I did January 10th 2020 and dec 2021

MOVE TO A 75 TO 85 % NET SHORT ON ANY RALLY NEAR THE HIGH RSI NON CONFIRMATION .I will now move to a net short 75 to 85 % on any rally today to even

OEX vs SPYThis is a ratio of the OEX to the SPY. Which is a ratio of the market cap of S&P 100 vs. the S&P 500.
It is interesting to note that during previous bubbles, such as 2000 tech bubble and 2007 housing bubble, there was a considerable increase in the ratio of the S&P 100 to the S&P 500.
At the moment, many are ringing the alarm bells on the 2021 bubble. However, as we can see, this analysis does not suggest any major issue, if history is any indication. However, this is just one model.

Next target is 1789Hi there, we have double bottom & I expect that price will rise to 1789 but we have a strong resistance on 1776 line,so you can choose 1774 for your target.
good luck.

OEX S+P 100 Upside Break Out to All Time HighI use the "OEX" CBOE S+P 100
as an overall market confirming Trend Index
Comprised of the 100 largest capitalization companies on the NYSE and Nasdaq,
the OEX is a "proxy, and broad range"for United States cooperate performance.
This past week...
the OEX broke out to an historic all time high closing at 1547.90,
clearing the Feb 2020 top, prior to the onset of the pandemic.
.
Traders should look for any pullback in the OEX to Buy,
although the market is not giving you that opportunity now.
With a complex bottom being formed in the CBOE Put/Call Index,
quantified evidence on the OEX shows a very bullish" and significant upside market breakout.
THE_UNWIND
8/8/20
NEW YORK


ABC FLAT ENDING NOW MOVE TO 60 % LONG FROM A 60 % SHORT FRIDAY ABC DECLINE ENDING NOW WATCH FOR 1209 UPSIDE

OEX has achieved the 100% expected move$OEX is the S&P 100 and heavily weighted AAPL, MSFT, and AMZN. Today's move is actually gaping above the 100% expected move. Sure looks quite risky to hold in here. Toppy

OEX 100 CYCLE LOW DUE NOW I HAVE MOVED TO 100 LONG THE UPSIDETHE WAVE STRUCTURE IS ENDING THE CORRECTION NOW WAVE C DOWN IN SP 100 IS 5 WAVE DOWN FOR WAVE C of B down i see a 5 wave rally in wave C UP TO PEAK IN WAVE B WITHIN 11 TRADING DAYS AT 1277 TO 1281 . BEST OF TRADES


Cycle View SPX-old chart from a few months ago never published with mid-June 'top'
-wave count was just for practice
-OEX is smart money of SPX

$OEX coming v close to a meaningful top$OEX coming v close to a meaningful top. Fib ext ABCD and T chart all colliding . Take short by next week if rises further 1%

OEX100 Long wicks = Distribution!! Not StrengthEX100 Long wicks = Distribution!! Not Strength, triple top... whatever you call it... it is distribution!
Accumulation has few wicks because it is inefficient fills, so institutions are selling, not buying...
I'm Sell Sell Selling...

Wolfe Wave Pending; Model Targets 1063.34 | #elliottwave $SPXFriends,
I would like to consider the possibility that the SP500 Index might carve out a higher high, based on a set of technical conditions I will define below.
PREDICTIVE/FORECASTING MODEL:
First and foremost, the Predictive/Forecasting Model I use in the foreground of my analysis has defined a probable bullish target, namely:
- TG-Hix = 1063.34 - 12 OCT 2015 (For those intrigued by numeral plays, you might perhaps enjoy the mathematical relationship of this relative to the fractional period)
This target is a qualitative target, or Qual-Target, which not only represents the highest allowable target by the Predictive/Forecasting Model, by also by its nature will tend to impose a reversal - not just retracement - as a counter-force against price.
ELLIOTT WAVE:
Now, looking at the general gist of price action in terms of Elliott Wave count, I have ascribed three degrees of scale to this monthly chart:
1 - A Cycle degree, denoted by the tail-end of a large multi-year bullish impulse, denoted by circled points , and (here using the brackets to indicated a circle)
2 - An Intermediate degree denoted by the last bullish impulse in parenthesed points (1)-(2)-(3)-(4)-(5), whereby point (3) carved the historical top and the reactive low in point (4) remains a tentative structure low, likely expressing the beginning of a zig-zag based on its initial reactive, counter-trend impulse (Note: a ZZ is the only correction expressing its initial leg in a 5-wave form). Point (5) is thus pending.
3 - A Minor degree denoted by a completed impulse of internal minor points 1-2-3-4-5 of intermediate wave (3).
Note also that as a general rule, an extended 3rd wave is associated with an equality rule, relating Wave-1 and Wave-5 such that the two are equal in height (here, 237.42 points), such that Intermediate wave-5 is expected to reach 1044.87.
WOLFE WAVE ANALYSIS
A 5-point geometry is nearing its entire cycle, expressed by Mr. Bill Wolfe's Wolfe Wave, where convergence of 1-3 and 2-4 Lines define a 1-4 Line, also known as the "Target Line" - This TL remains pending and quite proximal to a potential rallying.
FIBONACCI ANALYSIS:
First, let's propose that the recent Intermediate Wave 5 and Intermediate wave 4 hold the following Fibonacci relationship, such that:
Intermediate Wave 5 = 1.618 x Intermediate Wave-4 = 1035.49.
This Fibonacci based target (which is one that is quite standard and typically anticipated when relating these waves) comes near-alignment to above Predictive/Forecasting Model = 1063.34, and in even closer alignment with the equality-based intermediate wave-5 = 1035.49.
OVERALL:
Whereas the Predictive/Forecasting Model stands as an independent element in the analysis, it is interesting to note that there is compelling evidence which can be made here to expect not only further advance in the SP-500 Index, but also a probable reversal at the 1035.49/1044.87/1063.34 cluster.
To be followed.
Best,
David Alcindor
Predictive Analysis & Forecasting
Durango, Colorado - USA
-----
Twitter: @4xForecaster
LinkedIn: David Alcindor
TradingView: www.TradingView.com
-----
.

S&P 100 - this will trigger the S&P 500 collapseS&P100 Index is the basket that contains Huge and Large Caps - almost 50% of the US Equity Market.
At first view the area between 816 and 840 is extremely important for this Index. An invalidation of this support will be critical for the S&P100 and also for the entire US Equity Market.
You should keep an eye on this one too.

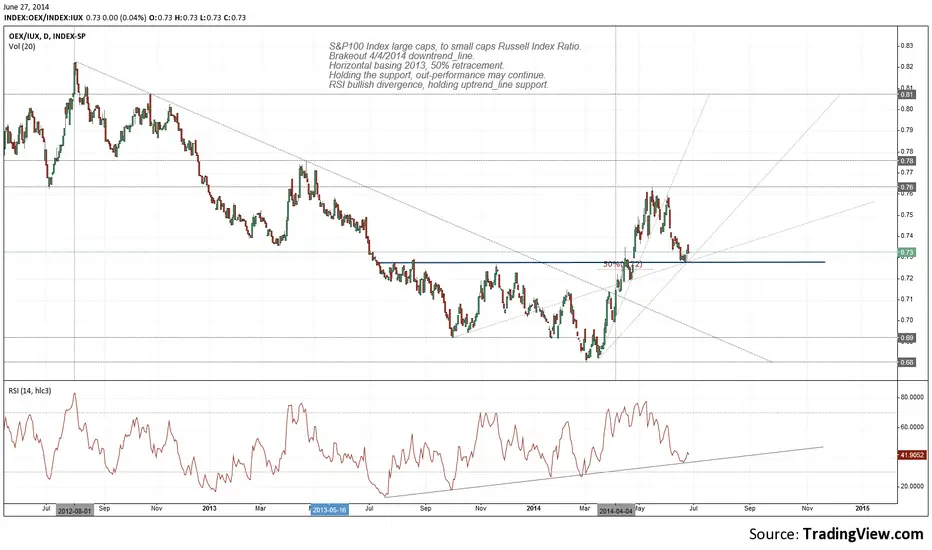
Large caps to small caps RatioS&P100 Index large caps, to small caps Russell Index Ratio.
Brakeout 4/4/2014 downtrend_line.
Horizontal basing 2013, 50% retracement.
Holding the support, out-performance may continue.
RSI bullish divergence, holding uptrend_line support.
OEXOEX is showing weakness however it is
still bullish above the cloud but under pressure.
If price closes below the Kijun line - blue line i will
buy a put spread with a target of 800 on the top of
the cloud for my target. Bias is still bullish though

BSI index"Blue Skies index" Is still not pointing towards any longer term bearishness. It will in due time.. It will :)
Patience
