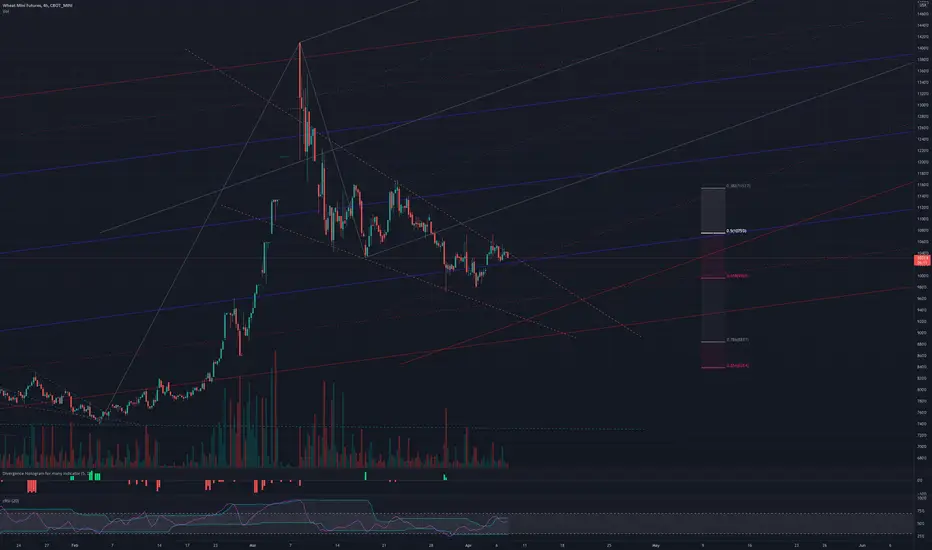
ZW2! update -18/04/2022expecting a strong move near 1400 to complete wave (5), next key level to note at 1139.6, critical support at 967.2
ZW1! trade ideas

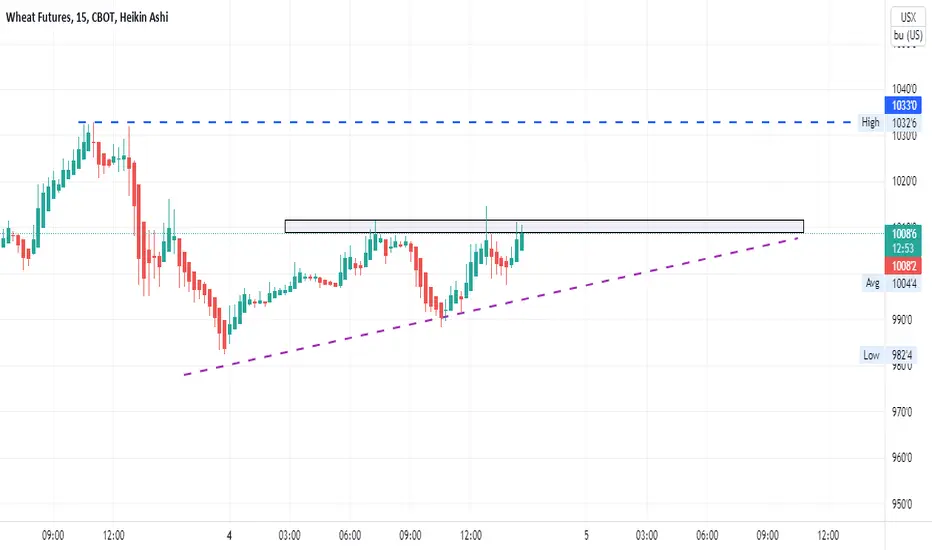
Apr 5, 22 Wheat Go Long My FriendsI've been watching whaet for a while now waiting for a bottom. Hopefully last week was the bottom. I put a Buy Order in at 1000 on Friday and wheat is slowly moving up.
With the war and drought going on, spring planting is screwed in Ukraine and Russia which account for about 25% of the worlds wheat.
I'm in this one for the long haul - hoping wheat will keep going up to 1300, maybe higher once the world realizes there is going to be a massive shortage.
Stay safe.
Heiko

WHEAT FUTURESA nice, strong wheat move that came out of the price channel and took an upward trend that we could come in with and expect a very strong ascent, and Baden God is good.

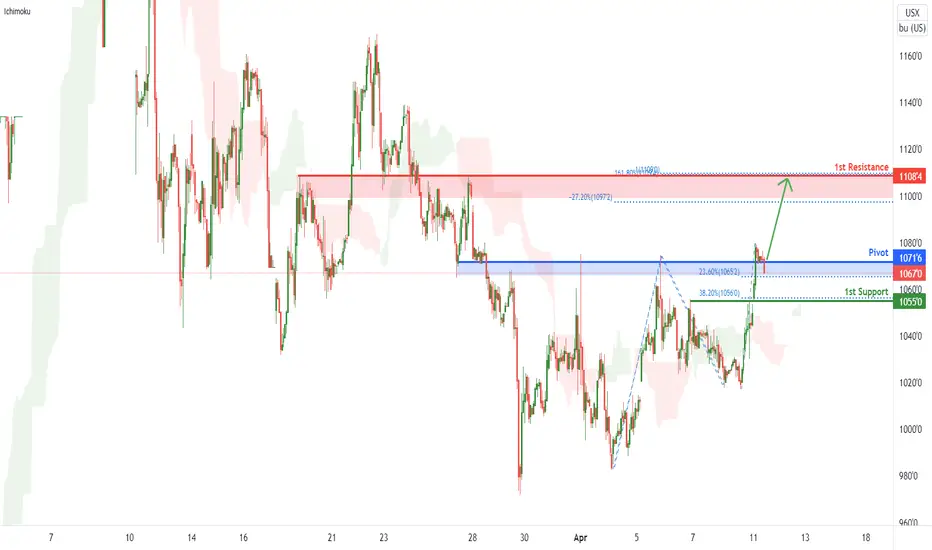
Wheat Futures ( ZW1! ), H1 Bullish Bounce!Title: Wheat Futures ( ZW1! ), H1 Bullish Bounce!
Type : Bullish bounce
Resistance : 1108'4
Pivot: 1071'6
Support : 1055'0
Preferred Case: Prices are at a pivot. We see the potential for a bounce from our pivot at 1071'6 in line with 23.6% Fibonacci Retracement towards our 1st resistance at 1108'4 which is an area of Fibonacci confluences. Prices are trading above our ichimoku clouds, further supporting our bullish bias.
Alternative scenario: Price might continue to dip towards the 1st support level of 1055'0 in line with 38.2% Fibonacci retracement.
Fundamentals: No Major News
Waiting game on wheatConsolidation in price could lead to another strong move to the upside. Finding support near a lower medium line and inner warning line on two schiff pitchforks. Retracement from the high at 62%, but need to wait for confirmation of upward move.
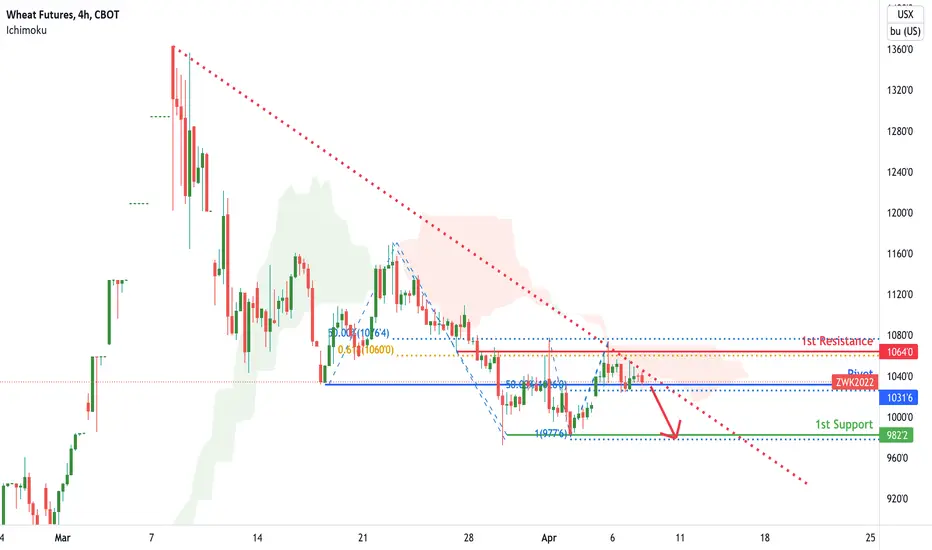
Wheat futures are momentum! | 7th April 2022Title: Wheat Futures (ZW1!), H4 Bearish Dip
Type : Bearish Dip
Resistance : 1064'0
Pivot: 1031'6
Support : 982'2
Preferred Case: Prices are on bearish momentum and abiding by a descending trendline We see the potential for a dip from our Pivot at 1031'6 in line with 50% Fibonacci Retracement towards our 1st support at 982'0 in line with 100% Fibonacci Projection . Prices are trading below our ichimoku cloud resistance, further supporting our bearish bias.
Alternative scenario: Price might continue to climb towards the 1st resistance level of 1064'0 in line with 50% Fibonacci retracement and 61.8% Fibonacci Projection.
Fundamentals: No Major News
Wheat Futures (ZW1!), H4 Bearish DipType : Bearish Dip
Resistance : 1075'6
Pivot: 1036'6
Support : 982'0
Preferred Case: Prices have approached our Pivot at 1036'6 in line with 61.8% Fibonacci Retracement . We see the potential for a dip from our Pivot at 1036'6 towards our 1st support at 982'0 in line with 61.8% Fibonacci Projection . Prices are trading below our ichimoku cloud resistance, further supporting our bearish bias.
Alternative scenario: Price might continue to climb towards the 1st resistance level of 1075'6 in line with 100% Fibonacci projection .
Fundamentals: No Major News

Wheat Futures (ZW1!), H4 Bearish DipType : Bearish Dip
Resistance : 1075'6
Pivot: 1036'6
Support : 982'0
Preferred Case: Prices have approached our Pivot at 1036'6 in line with 61.8% Fibonacci Retracement. We see the potential for a dip from our Pivot at 1036'6 towards our 1st support at 982'0 in line with 61.8% Fibonacci Projection. Prices are trading below our ichimoku cloud resistance, further supporting our bearish bias.
Alternative scenario: Price might continue to climb towards the 1st resistance level of 1075'6 in line with 100% Fibonacci projection.
Fundamentals: No Major News

ABC BullishAlso a bull flag. A flag is neutral until a trendline is broken with a trend in that direction.
The top trendline of the flag is resistance, so price needs to break through that trendline with conviction.
ABC patterns are simple pull back patterns. Target is D. Possible stop under C.
No recommendation and this is not to long entry level yet.

WHEAT FUTURESThe arrow is in a strong upward trend and its penetration into a strong grandfather's resistance point will see wheat accelerate very strong
wheatprojectfor a school project. Initial supply shock to the wheat market after the invasion of Ukraine

Wheat Watching and waiting patienlyJust watching to see if we have support at some point we're at GP now.


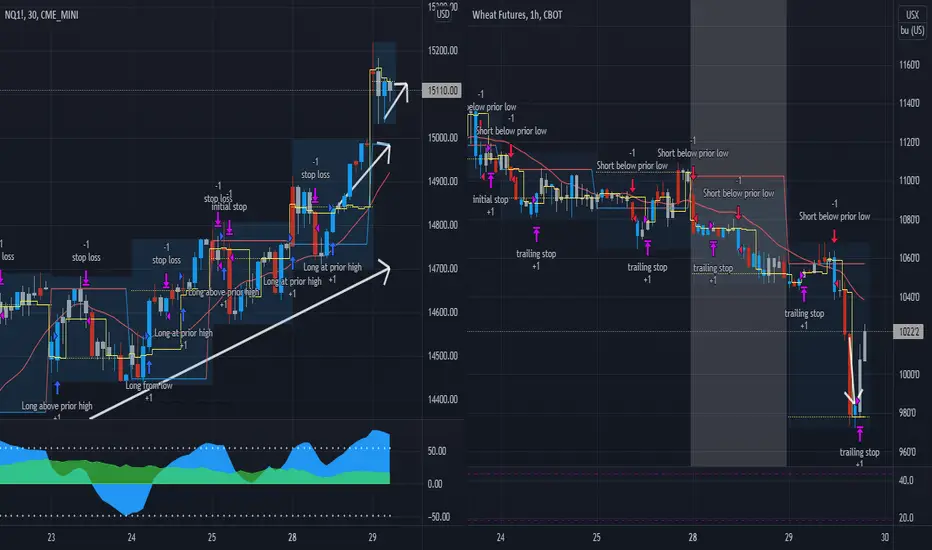
Update on 1 hour / 30 min strategy re-entriesWheat had a 60 point gain (trailing stop above prior 1 hour bar)
and Nasdaq on 30 min chart has an open profit of 60 points.
On long trades you can always make re-entries near the low of the prior two bars as here is a 2 bar trailing stop
On short trade you can always make re-entries if the risk is low (distance to current prior bars high) thats why I added to the wheat short postion at 8 am easter time...
Wheat - 2 long / 2 Short scenarios - Good bread takes timeGeneral
Wheat seems to generate a nasty SFP. It took out the recent Swing High and then dropped over 22%. With the monthly close coming soon i could image it going lower before finding support.
I marked 4 Scenarios which i would be happy to take either.
1. Long (Blue arrow)
Price moves to the red rectangle (area 1), finds support and "generates a swing". Price goes lower before breaking above the generated swing where i would then look on a LTF for an entry.
Target: A bit under the range high
SL: Depending on the LTF entry i wouldnt want to see it going lower than support
Invalidation: Price breaking under area 1
Time duration: Days, weeks, months, years... ;)
2. Long (Orange arrow)
Price moves under area 1 but manages to retake it. Enter on retest of area 1.
Target: A bit under the range high
SL: A bit under area 1
Time duration: Days, weeks, months, years... ;)
1. Short (Red arrow)
Price moves under area 1 aswell level 2. Enter on retest of level 2.
Target: The next big support level (Also in confluence with the 50% of the lower range.
SL: A bit above level 2
Time duration: Days, weeks, months, years... ;)
2. Short (Yellow arrow)
Price breaks under area 1. Enter in LTF on retest.
Target: The next big support level (Also in confluence with the 50% of the lower range.
SL: A bit above area 1
Time duration: Days, weeks, months, years... ;)
Good luck

Wheat Futures....are soaring by eight percent and reach the daily trading limit as the situation in the Ukraine remains dangerous and the Black Sea region is cutting back production severely. US farmers probably reduce acreage as well, while planting possibly gets delayed due to bad weather events.

zwThe market is now in perfect condition for sale if this hallway breaks down we will witness a descending wave

WHEAT FUTURESWheat in a very strong occasional path can get very strong bounce over the last few days.

Wheat Futures Daily Geometry — Ellipse1. Daily wheat futures prepares to exit ellipse after trading below the 78° and 71° resistance/support angles (Bayer, 1946).
2. Trend change due on the Helio Mercury—Jupiter, —Saturn conjunctions (Bayer, 1946).

wheat backwardation at extreme levelslotta folks (myself included) thinking about how sticky these commodities will play out
is this time different or are we going to pull a 2008

ridethepig | Wheat for the Yearly Close📌 @ridethepig ZW1! Market Commentary 17.12.2020
For buyers the breakout creates the typical starting point, one we have seen many many times before. The fact it is happening on the monthly chart is very telling, this is threatening to impulsive explode to the topside via shortages on the supply side from lockdowns and contractions in globalisation.
Whatever may be the case on the climate side (and I am certainly no expert here) it has been one of the biggest crops on year for Russia. Fertile farming at its best... Tracking closely the 600 support, for a move towards 900 and 1350 ... watch out for any battle against this in the coming weeks as we enter into a commodity cycle.
Thanks as usual for keeping the feedback coming 👍 or 👎

Wheat: Is the bull market over?Hello and Welcome,
We expect wave (3) to end at 1157.6 which at this level wave (3) will equal 3.618 multiply of wave (1).

Re-entry long on CommoditiesAll commodities on my watchlist
www.tradingview.com
are still long.
yes there was a take profit on wheat on oil below prior days low (usuaylly two days low but because of bars ranges that a much higher than prior day I am using a 1 day trailing stop)
Buying new highs on the 5 min chart below prior days low is a valid re-entry pattern.
Will we reach new yearly highs? I dont know but we can see that at least a double top should be possible or at least a rally up to 50% of prior down move...
