Short MYM based on ICT conceptsShorting MYM based on ICT London session Silver bullet. Grab of liquidity, break of structure to the downside. MYM is the weakest, many targets below.
YM1! trade ideas

#DowJones #US30 Action Areas For The Trading Week AheadIN this update we review the recent price action in the emini DowJones futures contract and identify some high probability action areas and price objectives to target

YM1! US30USD DOW 2023 June 12 WeekYM1! US30USD DOW 2023 June 12 Week
No change to previous analysis, observing reaction to 34605-34275 area. Last Friday's up bar
showed significant weakness.
Possible scenario:
Short if 34605-34275 is rejected again
Reason:
Higher low toward previous resistance, on reducing volume.
The professionals may engineer a false break to suck in traders unaware of the weakness.
We shall wait to short on rejection of recent high.
Price Reaction Levels:
Short on Test and Reject | Long on Test and Accept
35750 34605-34275
32692 31657
Price Volume Analysis:
Weekly: Ave vol up bar = NTC
Daily: Ultra low vol up bar close off high = significant weakness
Like and follow if you find this useful.
Have a profitable trading week.
*For education purpose only.

Dow bull not yet ragingSomebody whispered "new bull market!" into our ear overnight. Bull or no, we think DJIA futures have a bit further to pull back from recent overbought levels before the stampede begins in earnest.
Traders who agree can either short the September Dow futures, as here, or pick up some AMEX:DOG or $SDOW.

Dow Futures (YM) Rallying Higher as ImpulseShort Term Elliott Wave in Dow Futures (YM) suggests rally from 3.15.2023 low is in progress as a 5 waves impulse Elliott Wave structure. Up from 3.15.2023 low, wave 1 ended at 34363 and pullback in wave 2 ended at 32619. The Index has turned higher in wave 3 with internal subdivision as another 5 waves in lesser degree. Up from wave 2, wave (i) ended at 3330 and dips in wave (ii) ended at 32737. Up from wave (ii), wave i ended at 33212 and pullback in wave ii ended at 33060. Wave iii ended at 33863, wave iv ended at 33797, and wave v ended at 33894 which completed wave (iii).
Pullback in wave (iv) ended at 33448 as a zigzag structure. Down from wave (iii), wave a ended at 33665, wave b ended at 33780 and wave c lower ended at 33448. This completed wave (iv). Wave (v) of ((i)) is currently in progress. Up from wave (iv), wave i ended at 33745 and pullback in wave ii ended at 33635. Expect the Index to extend higher a few more highs to end wave v of (v) of ((i)). Then it should pullback in wave ((ii)) to correct cycle from 5.25.2023 low in 3, 7, or 11 swing before the rally resumes. Near term, as far as pivot at 32616 low stays intact, expect dips to find support in 3, 7, 11 swing for further upside.

YM1! US30USD DOW 2023 June 05 WeekYM1! US30USD DOW 2023 June 05 Week
Welcome myself back from holiday!
Some selling into higher prices, so will watch reaction to 24605-34275
area.
Possible scenario:
1) Short if 34605-34275 is rejected again
2) Higher low toward previous resistance, for long on retracement.
Retracement down bars need to be on lower volume for this to happen.
Price Reaction Levels:
Short on Test and Reject | Long on Test and Accept
35750 34605-34275
32695 31657
Price Volume Analysis:
Weekly: Lower vol wide spread up bar = possible weakness
Daily: Higher vol wide spread up bar = possible weakness
Like and follow if you find this useful.
Have a profitable trading week.
*For education purpose only.

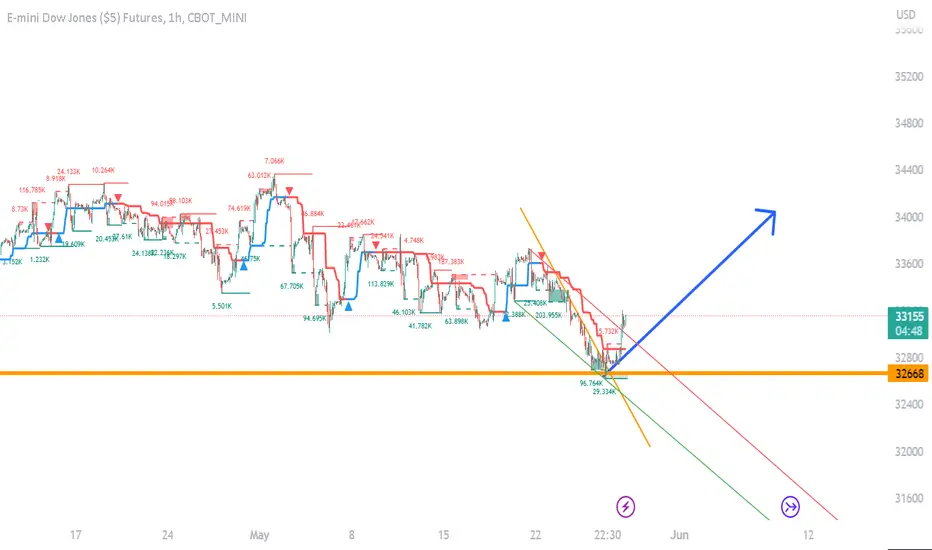
E-mini Dow Jones ($5) FuturesCBOT_MINI:YM1!
A strong decline with the main downward trend knowing that we have demand and supply areas that the market respected and will be very important when it arrives

#DowJones #US30 Action Areas For The Trading Week AheadIn this update we review the recent price action in the DowJones and identify some high probability action areas for the trading week ahead

changed its trendThe Dow Jones has changed its trend and will move from the daily floor to the daily ceiling
#DowJones #US30 To Test The Equality ObjectiveIn this update we review the recent price action in the DowJones and identify the next high probability trading opportunity and price objectives to target

Dow 4hour say= when pinbar comes,pick buy and hold when you see buy pinbar on 1hour or 4hour or daily chart ,pick buy with SL=pinbar low
wait time=2week
predict=dow,nasdaq,sp500 will see all time high again (35000) but with 2-3 mini crash
if you have old buys,dont fear, if red area break,hedge your buys
wish you win

Dow Jones H4 As 33k Supports Target A Test Of 34kIn this update wee review the recent price action in the emini #DowJones futures contract and identify the next high probability trading opportunity and price objectives to target

NABO - DJIAThere is a nabo here. Note how it tries to break above but really lingers a long time here.

US30 Initial Weekly Analysis Even though we had some strong fundamentals that pushed U30 to upside it is still technically bearish. If price exceed invalidation area, then I would look to reanalyze this.

DJIA Expected To Recover From 32500-32800 areaThats a nice pattern on DJIA; five up and now three down underway, so ideally more gains will come, but after wave C down that is still missing. We may see a bounce later this week from around 32500-32800 area.

Dow Jones/US30 Market Maker Sell Model I see DXY trading to a premium array. YM gives me market maker sell model vibes. Looking for a discount array to be the draw on liquidity.

YM1! US30USD DOW 2023 15 May WeekCBOT_MINI:YM1!
Last week's test and reject 33670 short yielded 270pts.
Market approaching intermediate axis 32994.
Possible scenario:
1) 32994 is supported and market returns into 33850-32994 range
2) 32994 becomes resisted and market head toward 31657/30513
Price Reaction Levels:
Short on Test and Reject | Long on Test and Accept
33632
34275-34605 33850
32994-33195
31657
Price Volume Analysis:
Daily & Weekly: Possible No Supply down bar close off low = strength
Like and follow if you find this useful.
Have a profitable trading week.
*For education purpose only.

dow short entry day tradesell the pitchfork re test, look for a move to the median line at best. CBOT_MINI:YM1!

Dow Jones H1 Look For 33420's To Support For A Test Of 34000In this update we review the recent price action in the emini #DowJones futures contract and identify the next high probability trading opportunity and price objectives

YM1! US30USD DOW 2023 MAY 08 WEEKCBOT_MINI:YM1!
Test and reject of 34275 for first week of May:
Entry: 34105 | Risk 100pts (reduced size) | Exit 33674 | Profit 430pts
Now that YM has exited rotation, and tested boundary, we may see the
likelihood of a rejection trade from 33670. Set your alarm there.
Possible scenarios:
1) Test and reject of 33670 = short
Volume Analysis:
Daily: High volume breakdown from rotation, followed by lower
vol up bar close off high = confirmation of supply overcoming demand
H4: Lower vol up bar close off high = weakness
Price reaction levels
Short on Test and Reject | Long on Test and Accept
35228 34605 34275
33670 32681 31657
Remember to like and follow if you find this useful.
Have a profitable week ahead.

Dow shortTesting mobile app published idea. Short with a tight stop looking for continuation to the downside.

5-2-23 [dow jones]gm,,,
haven't been posting anything public lately - too busy with the private content.
----
created a few minute window today to write this up, and a few others.
----
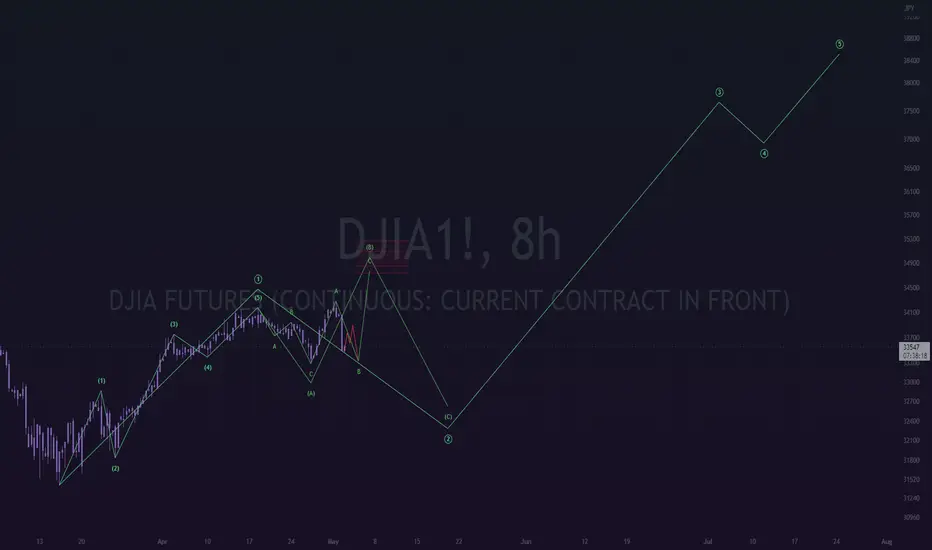
i am envisioning a massive move to the upside on this dow jones index.
estimating for it to take out the all time highs.
> sounds bananas right?
> maybe to you, anon.
----
og post:
DowJones 1000points Higher From Support, What Next?In this update we review the recent price action in the emini #DowJones futures contract and identify the next high probability trading opportunity and price objectives to target
