CELOUSDT 1DCELO ~ 1D Analysis
#CELO Buy gradually after successfully penetrating this resistant line with a short -term target of at least 10%+.

CELOUSDT 1D#CELO is moving inside a falling wedge pattern on the daily chart and heading toward the pattern resistance and the daily MA50. In case of a breakout, the targets are:
🎯 $0.3771
🎯 $0.4544
🎯 $0.5833
🎯 $0.6874
🎯 $0.7915
Use a tight stop-loss.

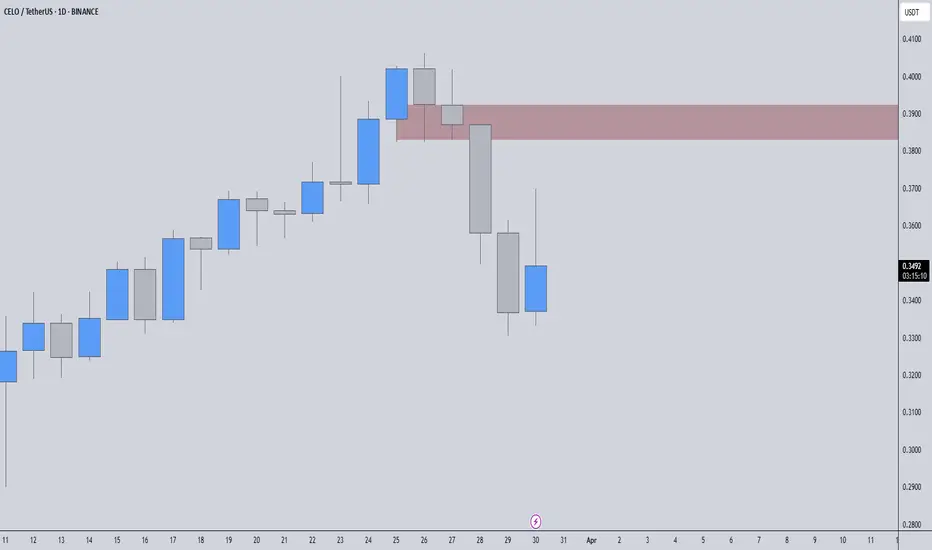
CELOUSDT – One of Today’s Highest Volume Gainers! CELOUSDT – One of Today’s Highest Volume Gainers! 🚨
🔴 Key Resistance Zone:
The red box marks a critical resistance level where we’ve historically seen strong selling pressure. This isn’t just any level—this is where liquidity gets tested, and weak hands get trapped.
📉 How to Approach It:
✔ Short B
SPOT CELO LONG 14.03.2025Pinning after abnormal purchases.
💰I enter at the market price.
I'll let you know when I record it manually.
‼️Risk per trade: 1% of the allocated funds for spot trading.
Thank you!

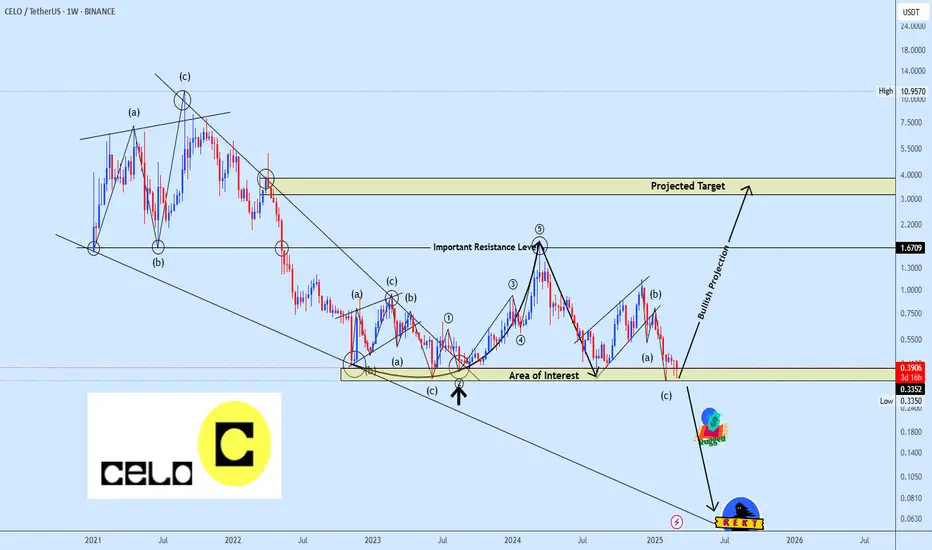
Celousdt trading ideaCELOUSDT initially broke out bullish from a falling wedge but faced strong rejection at the critical $1.67 resistance level, triggering a significant sell-off that retraced the entire breakout move.
Price has now retested the initial bottom, positioning the market for a potential double-bottom for
SPOT CELO LONG 27.02.2025Pinning after abnormal activity.
💰I enter at the market price.
I'll let you know when I record it manually.
‼️Risk per trade: 1% of the allocated funds for spot trading.
Thank you!

Long hello guys
An attractive opportunity to trade on Celo with a risk to reward of 7.
As expected on the characteristic chart, the downward trend will reach its end with some time correction and change the trend. The goals are specified on the chart.
This is my personal opinion. Please don't use your o

CELO /USDT 1W 🩸 SEED_DONKEYDAN_MARKET_CAP:CELO ⁀➷
#Celo. Macro chart Another
💯 Intermediate Target - $2.40
🚩 Macro Target 1 - $3.20
🚩 Macro Target 2 - $4.80
🚩 Macro Target 3 - $6.70
- Not financial advice, trade with caution.
#Crypto #Celo #CELO #Investment #L1
✅ Stay updated on market news and devel

CELO LONGCelo has bounced every time it touched the lower range around $0.40, usually reaching at least $0.25.However, given the current market conditions, I expect either more downside or a sideways movement in the next few days.
The Stoch RSI is gearing up for a bullish cross on the weekly, but historical

CELOUSDT 1WCELO ~ 1W Analysis
#CELO This is key support for this coin. This loss of support will be a big pressure on this coin. Bounce from here Bullish will begin to hold back control.

See all ideas
Summarizing what the indicators are suggesting.
Oscillators
Neutral
SellBuy
Strong sellStrong buy
Strong sellSellNeutralBuyStrong buy
Oscillators
Neutral
SellBuy
Strong sellStrong buy
Strong sellSellNeutralBuyStrong buy
Summary
Neutral
SellBuy
Strong sellStrong buy
Strong sellSellNeutralBuyStrong buy
Summary
Neutral
SellBuy
Strong sellStrong buy
Strong sellSellNeutralBuyStrong buy
Summary
Neutral
SellBuy
Strong sellStrong buy
Strong sellSellNeutralBuyStrong buy
Moving Averages
Neutral
SellBuy
Strong sellStrong buy
Strong sellSellNeutralBuyStrong buy
Moving Averages
Neutral
SellBuy
Strong sellStrong buy
Strong sellSellNeutralBuyStrong buy
Displays a symbol's price movements over previous years to identify recurring trends.