Bearish drop?AUD/CHF is reacting off the pivot which has ben identified as an overlap resistance and could drop to the overlap support.
Pivot: 0.57216
1st Support: 0.55944
1st Resistance: 0.58223
Risk Warning:
Trading Forex and CFDs carries a high level of risk to your capital and you should only trade with money you can afford to lose. Trading Forex and CFDs may not be suitable for all investors, so please ensure that you fully understand the risks involved and seek independent advice if necessary.
Disclaimer:
The above opinions given constitute general market commentary, and do not constitute the opinion or advice of IC Markets or any form of personal or investment advice.
Any opinions, news, research, analyses, prices, other information, or links to third-party sites contained on this website are provided on an "as-is" basis, are intended only to be informative, is not an advice nor a recommendation, nor research, or a record of our trading prices, or an offer of, or solicitation for a transaction in any financial instrument and thus should not be treated as such. The information provided does not involve any specific investment objectives, financial situation and needs of any specific person who may receive it. Please be aware, that past performance is not a reliable indicator of future performance and/or results. Past Performance or Forward-looking scenarios based upon the reasonable beliefs of the third-party provider are not a guarantee of future performance. Actual results may differ materially from those anticipated in forward-looking or past performance statements. IC Markets makes no representation or warranty and assumes no liability as to the accuracy or completeness of the information provided, nor any loss arising from any investment based on a recommendation, forecast or any information supplied by any third-party.
CHFAUD trade ideas

AUDCHF Bullish The trend is bullish as seen from the support, the trend is bullish till the price respect the uptrend support line.

AUDCHF: Short Term Sell OpportunityShort Term:
- Small Sell Opp.
- Price Trapped in Ranging
Uptrend
- Waiting for price to close below
Zone

AUDCHF Bank Robbery Plan on Bullish Direction to Steal MoneyMy Dear Robbers / Traders,
This is our master plan to Heist AUDCHF Bank based on Thief Trading style Technical Analysis.. kindly please follow the plan I have mentioned in the chart focus on Long entry. Our target is Red Zone that is High risk Dangerous level, market is overbought / Consolidation / Trend Reversal at the level Bearish Robbers / Traders gain the strength. Be safe and be careful and Be rich.
Note: If you've got a lot of money you can get out right away otherwise you can join with a swing trade robbers and continue the heist plan, Use Trailing SL to protect our money.
Entry : Can be taken Anywhere, What I suggest you to Place Buy Limit Orders in 15mins Timeframe Recent Swing Low
Stop Loss : Recent Swing Low using 2h timeframe
Warning : Fundamental Analysis comes against our robbery plan. our plan will be ruined smash the Stop Loss. Don't Enter the market at the news update.
Loot and escape on the target 🎯 Swing Traders Plz Book the partial sum of money and wait for next breakout of dynamic level / Order block, Once it is cleared we can continue our heist plan to next new target.
Support our Robbery plan we can easily make money & take money 💰💵 Follow, Like & Share with your friends and Lovers. Make our Robbery Team Very Strong Join Ur hands with US. Loot Everything in this market everyday make money easily with Thief Trading Style

audchf buyHere’s a bullish technical analysis for the AUD/CHF pair on the H4 chart:
Moving Averages: The AUD/CHF pair is trading above the 50-period and 200-period moving averages, indicating a bullish trend. The 50-period moving average has crossed above the 200-period moving average, forming a “Golden Cross,” which is a strong bullish signal1.
Relative Strength Index (RSI): The RSI is currently above 50, suggesting that the momentum is in favor of the bulls. If the RSI approaches the overbought territory (above 70), it could indicate strong buying pressure2.
MACD (Moving Average Convergence Divergence): The MACD line is above the signal line, and both are above the zero line, which is a bullish indicator. This suggests that the upward momentum is likely to continue3.
Bollinger Bands: The price is moving towards the upper Bollinger Band, indicating that the pair is in an uptrend. A breakout above the upper band could signal further bullish momentum2.
Support and Resistance Levels: The pair has recently broken above a key resistance level around 0.5700, which now acts as support. The next resistance level to watch is around 0.58001.
Volume: An increase in trading volume on bullish candles suggests strong buying interest and supports the bullish outlook3.
Overall, the technical indicators on the H4 chart for AUD/CHF suggest a bullish trend.

AUDCHFI have a theory regarding the AUDCHF currency pair that I believe will play out in the coming days. Based on my analysis and observations, I anticipate that the price will decrease. This expectation is grounded in a combination of factors that I track through my proprietary set of private indicators. These indicators have been meticulously developed and fine-tuned over time, giving me confidence in their predictive power. While market movements can be unpredictable and influenced by a multitude of external factors, I trust that my indicators provide a reliable basis for this forecast. Hence, I am preparing for a potential decline in the AUDCHF price.

AUDCHF BUY TF H4 TP = 0.5913On the H4 chart the trend started on Aug. 06 (linear regression channel).
There is a high probability of profit taking. Possible take profit level is 0.5913
Using a trailing stop is also a good idea!
Please leave your feedback, your opinion. I am very interested in it. Thank you!
Good luck!
Regards, WeBelievelnTrading

AUDCHF Will Fall! Short!
Take a look at our analysis for AUDCHF.
Time Frame: 3h
Current Trend: Bearish
Sentiment: Overbought (based on 7-period RSI)
Forecast: Bearish
The market is trading around a solid horizontal structure 0.572.
The above observations make me that the market will inevitably achieve 0.564 level.
P.S
We determine oversold/overbought condition with RSI indicator.
When it drops below 30 - the market is considered to be oversold.
When it bounces above 70 - the market is considered to be overbought.
Like and subscribe and comment my ideas if you enjoy them!

AUDCHFWe have just broken the lower trend line and now waiting to see if this is a fake out for a continuation of trend to the upside, staying inside the channel, to the next resistance.
If the break of the trend isn't a fake out, and we are just having a retest of the trend line, I will wait for a break for structure to the downside to be sure of a sell down to the next support.

AUD-CHF Short From Resistance! Sell!
Hello,Traders!
AUD-CHF went up and
The pair is locally overbought
So as the pair is retesting
The horizontal resistance
Of 0.5726 we will be
Expecting a further
Move down
Sell!
Like, comment and subscribe to help us grow!
Check out other forecasts below too!

AUDCHF bullish ideaIt is based onn the trend, channel, weekly chart, T/P Daily S/R, Bullish Flag on Daily

AUDCHF buyaccording to the CHF index, which made annual high expecting the bull movement on this pair


AUDCHF IDEADear friends and followers, it's best of my idea of AUDCHF..
Buy now and let enjoy together..
Good luck

AUD/CHF +70 Pips In Less Than 2 Hours , Did You Enter ?If We Have a Daily Closure Above 0.57000 We can add another entry To the same Targets
This Is An Educational + Analytic Content That Will Teach Why And How To Enter A Trade
Make Sure You Watch The Price Action Closely In Each Analysis As This Is A Very Important Part Of Our Method
Disclaimer : This Analysis Can Change At Anytime Without Notice And It Is Only For The Purpose Of Assisting Traders To Make Independent Investments Decisions.


AUD/CHF 1H timeframeAUD/CHF 1H timeframe day trade, do not risk more than 1% of your capital on this trade.

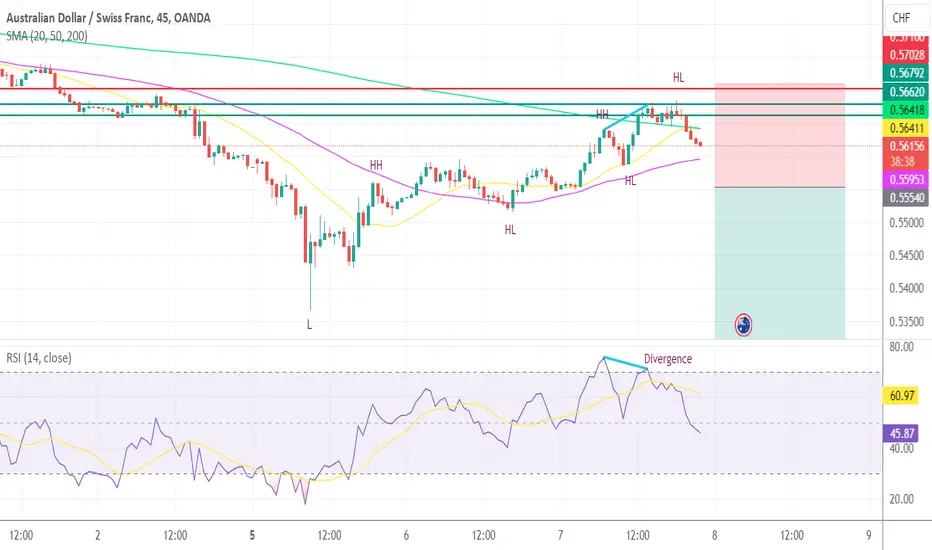
AUDCHF bearish divAUDCHF making bearish divergence
EP below last HL
SL above last HH
keep margins for spread
Massive Buying Opportunity: Is a Move to 0.64 Next?This pair is shaping up to be one of my favorite trade setups: the trendline break and retest of the level/zone that broke the trendline.
Looking at the Monthly chart below, we’ve seen a significant downtrend for nearly two years that ended in February this year. At that time, I posted a buy setup, buying dips under 0.57 and targeting the 0.60 level as the first target.
This initial leg has now completed. As explained in the related post from February, after this leg, we would likely see a move back down to test the area that caused the trendline break.
This phase has now played out, and the next likely path is a dip back under 0.57, followed by the start of a new leg in the Monthly uptrend, targeting new highs and the Monthly sell zone starting at 0.63, where we’ll likely see selling interest.
Of course, we don’t just blindly enter when the price dips below 0.57. Instead, we wait for price action to give us cues that momentum is slowing down by zooming into the lower timeframes.
One of my favorite indicators for reading the slowing of momentum is the MACD indicator, specifically looking for divergence signals on the lower timeframes.
If you check the 4-hour chart below, you’ll see we are already starting to get divergence signals.
The 8-hour and 6-hour charts also show the same divergence signals, indicating that selling momentum is starting to slow down as we approach a key HTF area of interest.
What I expect next is a brief dip back under 0.57, followed by a surge higher. We may even dip a little lower towards 0.56.
I will use my TRFX indicator and patiently wait for buy signals on the 4-hour to 12-hour charts before starting to build my buying position.
The first target will be 0.605, and if this position plays out as expected, a clear move up to 0.63 is on the cards.
If you like the idea and found value, hit the boost button. Happy trading!

AUD / CHF LONG Higher timeframes show that we are in a bullish trend.
We have retested and held the previous major zone - the last high.
Price should not continue to make a new higher high.

AUD/CHF For Bearish after finish pull-backgo short now
- General Trend is Down
- price finish its pull-back at red arrow
have fun :)

AUDCHFThis Weekly FORECAST
Opportunity for AUDCHF. This setup trading idea is for intraday. >> TAYOR
Risk Factors:
1. Market conditions, unexpected news, or external events could impact the trade.
2. Always use risk management strategies to protect your capital.

AUDCHF shortWe shall be selling AUDCHF from 21 pips SL zone for 190pips profit or from 9 pips SL zone for 270 pips profit. RBA interest rate decision might not let it go much up so i am not ignoring the 21 pips SL zone since its also offering good RR.
