CHFUSD trade ideas
support & resistance tradingexpecting price to bounce from res level and entry after full body bearish candle

USD/CHF For Bullish as pull-backwait for pull-back near by entry point and then go long
general trend is down
current phase is pull-back
have fun :)

USD/CHF SELLERS WILL DOMINATE THE MARKET|SHORT
Hello, Friends!
USD/CHF is making a bullish rebound on the 3H TF and is nearing the resistance line above while we are generally bearish biased on the pair due to our previous 1W candle analysis, thus making a trend-following short a good option for us with the target being the 0.878 level.
Disclosure: I am part of Trade Nation's Influencer program and receive a monthly fee for using their TradingView charts in my analysis.
✅LIKE AND COMMENT MY IDEAS✅

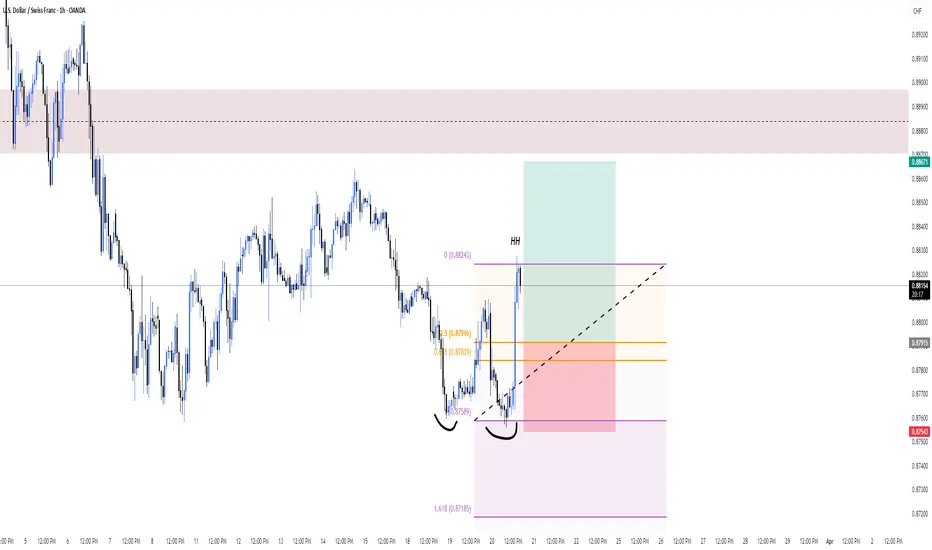
USD/CHF at Support – Buy Above Last Lower HighUSD/CHF is trading around its daily support level, with bullish divergence indicating a possible upward pullback. A buy above the last lower high is suggested for breakout confirmation.

CHF/USD Bearish Reversal: Trendline Break Strong Sell-Off!his CHF/USD (Swiss Franc/U.S. Dollar) 1-hour chart showcases a bearish trading setup, signaling a potential downside move after a failed breakout at a key resistance level. Below is a comprehensive breakdown of the chart, highlighting key technical elements, potential trade setups, and risk management considerations.
1. Identified Chart Pattern – Cup & Handle (Failed Breakout)
The chart initially formed a Cup and Handle pattern, a bullish continuation setup where:
The rounded bottom (cup) indicated accumulation and a gradual shift in trend from bearish to bullish.
The handle consolidation represented a minor pullback before a potential breakout.
However, the pattern failed to hold its bullish momentum. Instead of continuing higher, the price was rejected at the resistance level (ATH – All-Time High), signaling a shift in sentiment.
2. Key Technical Levels
Resistance Level + ATH (All-Time High)
The price reached a significant resistance zone (marked in blue), aligning with an all-time high (ATH) level.
Multiple rejections at this level indicate strong selling pressure, making it a potential distribution area where smart money is offloading positions.
Support Level + Reversal Zone
After rejection from the resistance, the price retraced to a critical support zone, previously acting as a demand area (buyers stepping in).
A break below this level confirms bearish momentum, increasing the likelihood of further downside movement.
Trendline Break – Bearish Confirmation
The trendline (marked in black) represents the primary uptrend support that guided price movement.
The break below this trendline signals a loss of bullish strength, increasing the probability of a trend reversal rather than a continuation.
3. Projected Price Movement – Bearish Scenario
Given the trendline break and rejection from resistance, the chart suggests a bearish wave with the following expectations:
A retest of the broken trendline and support zone before continuing downward.
Lower highs and lower lows formation – confirming a new downtrend.
A potential drop towards key downside targets (marked as TP1, TP2, and the final target).
Take Profit (TP) Targets:
✅ TP1 (1.1128): A minor support level where price may find temporary buying interest.
✅ TP2 (1.1111): A more significant support area that previously acted as demand.
✅ Final Target (1.1035): The ultimate downside objective, aligning with a major support zone and historical price action levels.
Stop-Loss Placement (SL):
📍 Above the broken trendline OR the recent swing high, ensuring protection against false breakouts or retracements.
4. Trade Execution & Risk Management
Entry Strategy (For Short Positions)
🔹 Aggressive Entry: Enter short immediately after the support zone break.
🔹 Conservative Entry: Wait for a retest of the support-turned-resistance area for confirmation before shorting.
Risk-Reward Ratio Consideration:
A properly placed stop-loss above resistance ensures a favorable risk-to-reward ratio.
Ideal ratio: 1:2 or better, meaning potential reward should be at least twice the risk.
5. Market Sentiment & Possible Alternative Scenario
While the primary outlook is bearish, traders must remain flexible and monitor price action closely:
If price reclaims the support zone and breaks above resistance, it invalidates the bearish setup, shifting momentum back to bullish.
A sustained close above the trendline could trap early sellers, leading to a short squeeze rally back toward resistance.
6. Final Thoughts
🔹 Bearish Bias: This setup favors downside movement due to trendline break, resistance rejection, and market structure shift.
🔹 Key Levels to Watch: Support zone retest, trendline confirmation, and target levels.
🔹 Risk Management is Essential: Using stop-loss protection and proper trade sizing to mitigate potential losses.
Conclusion: High-Probability Bearish Setup
🚀 The CHF/USD pair has shifted to a bearish structure after failing to break its ATH resistance. The breakdown of the trendline and key support level suggests a strong sell-off towards the 1.1035 target. Traders should look for short opportunities on pullbacks while managing risk effectively.
Would you like me to refine or simplify any part of this analysis for your TradingView post? 📉🔥

Analysis on 10 Elite Forex and Commodity(Gold $ SiLVER) PairsWe trade on only these 10 Elite Forex and Commodity(Gold $ SiLVER) Pairs.I would be able to Assist you on analysis only when its these 10 Pairs that we Focus..ENJOY!!

USDCHF...*USDCHF Trade Analysis & Evaluation*
*1. Trade Setup Overview:*
- *Entry Condition:* Buy signal triggered if USDCHF consolidates above *0.8815* and the 50-period Moving Average (MA50), suggesting a bullish breakout.
- *Targets:*
- *Target 1:* Likely typo; assumed corrected to *0.8860* (45 pips above entry).
- *Target 2:* *0.9145* (330 pips above entry).
- *Key Levels:* Trend line resistance break, MA50 dynamic support.
---
*2. Technical Analysis:*
- *Trend Line Breakout:* A breakout above a descending trend line indicates potential bullish reversal. Consolidation above confirms strength.
- *MA50 Role:* MA50 acting as support post-breakout adds bullish confirmation.
- *Momentum Indicators:* Check RSI (above 50) and MACD (bullish crossover) to validate upward momentum.
- *Volume:* Rising volume during breakout increases validity.
---
*3. Target Rationale (Adjusted):*
- *Target 1 (0.8860):* Near-term resistance level or 1:1 risk-reward ratio.
- *Target 2 (0.9145):* Longer-term resistance, aligning with a measured move or swing high.
---
*4. Risk Management:*
- *Stop Loss:* Place below *0.8795* (20 pips below entry), ensuring a 1:2.25 risk-reward ratio for Target 1.
- *False Breakout Risk:* A close below MA50/0.8815 invalidates the setup.
---
*5. Fundamental Considerations:*
- *USD Drivers:* Fed rate policy, US economic data (e.g., NFP, CPI).
- *CHF Factors:* SNB interventions, safe-haven flows (geopolitical risks).
---
*6. Conclusion:*
The trade is valid *if* the price sustains above 0.8815/MA50 with bullish momentum. Adjust Target 1 to *0.8860* to reflect logical profit-taking. Target 2 remains ambitious but feasible in a strong trend. Monitor fundamentals for USD strength/CHF weakness catalysts.
*👉 Action:* Wait for confirmed close above 0.8815/MA50, set stop loss at 0.8795, and trail profits if momentum holds.


USDCHF better Risk Reward Ratio(RRR)Simple trade on the USDCHF with better RRR ,Stop Loss and Take profit is indicated..ENJOY!!

USDCHF Musical Chair Music Begins! 1613SGT 20032025Yesterday or so, I posted about selling USDCHF but it is risky, and indeed risky it was because the opportunity has been utilised already.
We would need to wait for the music to stop and start again before we walk around the chairs, and now, the music has stopped and started, again.
Price came back to the 200SMA, to stop the music, and now we have a trend again signalling that the music has begun.
Price has made the first significant setup as seen on the chart.
I will only be eyeballing because I am testing out my theory.
I think I need to see my previous entries in the moving average series, to see what I done right and what I done wrong.
Done right = I profited
Done wrong = I loss
It's not perfect but I think I know what to look out for.
Look out for when price is retracing, and I entered that i profited.
And look out for when price was in its impulse move and I entered and loss.
1616SGT 20032025

BEARISH MOVEMENTUSDCHF is on descending channel, an ascending channel is broken to the downside, which is now giving us pure bearish move. Also on daily timeframe i can see bearish head and shoulder pattern, which additional confirmation for my analysis. So i'm for a sell risking 1%. Lets see the see the outcome

USD/CHF 15M Chart - Bullish Outlook!📈 USD/CHF 15M Chart - Bullish Outlook!
🟢 Demand Zone Identified!
Price is approaching the 0.87537 - 0.87400 demand zone, where a potential reversal could occur. If support holds, we may see an upward move toward key resistance levels.
📌 Key Levels to Watch:
🟢 Support Zone: 0.87537 - 0.87400
🚀 Breakout Target 1: 0.87887
🎯 Main Target: 0.88603
🔥 Potential Trade Setup:
🟢 Buy Near: 0.87537
🎯 TP1: 0.87887
🎯 TP2: 0.88603
🛑 SL: Below 0.87400
⚠️ Break Above 0.87887 could confirm further bullish momentum toward 0.88603. Trade wisely and manage risk!
#USDCHF #ForexTrading #SmartMoney #SupplyAndDemand #PriceAction #LiquidityGrab #FXFOREVER

SELLGod First
Minimum Risk Maximum Reward
Action Backed Believe
# faith, strategy, and execution all in one #

Could this be itI am going longs on this one and forecasting it by filling up the abrupt bearish trend,
still this is a safe trade for me since if it bounces back by touching the resistance, we could go breakeven on this one

USDCHF INTRADAY oversold bounce backThe USD/CHF price action exhibits bearish sentiment, supported by the prevailing downtrend. The current intraday swing high at 0.8860 serves as a critical trading level, as the pair shows potential for an oversold rally before facing bearish rejection.
Key Levels to Watch:
Key Resistance: 0.8860 (current intraday swing high)
Immediate Support: 0.8760
Lower Support Levels: 0.8720, 0.8680
Upside Resistance Levels: 0.8890, 0.8930
Bearish Scenario:
An oversold rally toward the 0.8860 level, followed by a bearish rejection, could validate the downtrend and target the immediate support at 0.8760. Continued bearish momentum could extend the decline to 0.8720 and ultimately 0.8680 over the longer timeframe.
Bullish Scenario:
A confirmed breakout above the 0.8860 resistance level, accompanied by a daily close above this mark, would negate the bearish outlook. This scenario could trigger further rallies toward the next resistance levels at 0.8890 and 0.8930.
Conclusion:
The prevailing sentiment remains bearish amid the ongoing downtrend. Traders should closely monitor the 0.8860 level for potential bearish rejections or a bullish breakout. A sustained close above this resistance could signal a shift toward bullish momentum, while failure to break above would reinforce the bearish outlook.
This communication is for informational purposes only and should not be viewed as any form of recommendation as to a particular course of action or as investment advice. It is not intended as an offer or solicitation for the purchase or sale of any financial instrument or as an official confirmation of any transaction. Opinions, estimates and assumptions expressed herein are made as of the date of this communication and are subject to change without notice. This communication has been prepared based upon information, including market prices, data and other information, believed to be reliable; however, Trade Nation does not warrant its completeness or accuracy. All market prices and market data contained in or attached to this communication are indicative and subject to change without notice.

If you don't have DXY, keep an eye on USDCHF.Today we are waiting for the Federal Reserve interest rate decision, where the Bank is expected to keep the rates unchanged. However, it's the press conference, which we are more bothered about. Keep your eyes on TVC:DXY , but if you don't have MARKETSCOM:DOLLARINDEX , then MARKETSCOM:USDCHF will be just as good.
Let's dig in.
FX_IDC:USDCHF
Let us know what you think in the comments below.
Thank you.
74.2% of retail investor accounts lose money when trading CFDs with this provider. You should consider whether you understand how CFDs work and whether you can afford to take the high risk of losing your money. Past performance is not necessarily indicative of future results. The value of investments may fall as well as rise and the investor may not get back the amount initially invested. This content is not intended for nor applicable to residents of the UK. Cryptocurrency CFDs and spread bets are restricted in the UK for all retail clients.

usdchf long buydouble bottom printed
two day support tested
neckline tested
use proper risk management

USDCHF to continue in the downward move?USDCHF - 24h expiry
Broken out of the channel formation to the downside.
Our short term bias remains negative.
Offers ample risk/reward to sell at the market.
The weaker US dollar has boosted performance.
20 4hour EMA is at 0.8801.
We look to Sell at 0.8799 (stop at 0.8839)
Our profit targets will be 0.8701 and 0.8681
Resistance: 0.8777 / 0.8800 / 0.8818
Support: 0.8759 / 0.8740 / 0.8720
Risk Disclaimer
The trade ideas beyond this page are for informational purposes only and do not constitute investment advice or a solicitation to trade. This information is provided by Signal Centre, a third-party unaffiliated with OANDA, and is intended for general circulation only. OANDA does not guarantee the accuracy of this information and assumes no responsibilities for the information provided by the third party. The information does not take into account the specific investment objectives, financial situation, or particular needs of any particular person. You should take into account your specific investment objectives, financial situation, and particular needs before making a commitment to trade, including seeking advice from an independent financial adviser regarding the suitability of the investment, under a separate engagement, as you deem fit.
You accept that you assume all risks in independently viewing the contents and selecting a chosen strategy.
Where the research is distributed in Singapore to a person who is not an Accredited Investor, Expert Investor or an Institutional Investor, Oanda Asia Pacific Pte Ltd (“OAP“) accepts legal responsibility for the contents of the report to such persons only to the extent required by law. Singapore customers should contact OAP at 6579 8289 for matters arising from, or in connection with, the information/research distributed.

CHF/USD Trading Idea – Bearish Reversal from Key ResistanceThis CHF/USD chart presents a compelling bearish setup, suggesting that the pair may be headed for a decline after facing strong resistance. The price action has followed a technical breakout and retest pattern, with a clear rejection from a well-defined resistance level.
Traders looking for short-selling opportunities should take note of the key price zones, support levels, and overall market structure before making a move. Let’s break it down in detail.
🔍 Chart Breakdown: What’s Happening?
1️⃣ Falling Wedge Breakout & Bullish Push
The price was consolidating inside a falling wedge, a pattern that typically signals an eventual breakout to the upside.
The breakout led to a strong bullish move, pushing the price toward a well-established resistance zone around 1.1414.
After breaking out, the pair made a significant upward run before stalling at this key resistance.
2️⃣ Key Resistance Level Holding Strong
The price touched the resistance zone but failed to break above it.
This rejection indicates that sellers are stepping in, absorbing the buying pressure.
The market is showing early signs of bearish momentum, hinting at a potential downtrend.
3️⃣ Projected Bearish Move: Lower Targets in Sight
If the current rejection holds, the price is likely to fall toward the nearest support levels:
✅ TP 1 (Take Profit 1): 1.1271 → First major support level, likely to be tested soon.
✅ TP 2 (Take Profit 2): 1.1201 → A deeper retracement if selling pressure increases.
✅ TP 3 (Take Profit 3): 1.1055 → Final downside target if the bearish trend extends further.
4️⃣ Stop Loss Placement – Risk Management
To manage risk, the ideal stop loss should be placed slightly above the resistance level at 1.1414.
This protects against potential false breakouts and unexpected market shifts.
📉 Trade Strategy – How to Approach This Setup?
🔸 Entry Point: Look for a confirmed rejection of the resistance level (e.g., bearish candlestick patterns like engulfing, shooting star, or pin bars).
🔸 Stop Loss: Place above 1.1414 to avoid getting caught in a short squeeze.
🔸 Take Profit Targets:
First TP at 1.1271
Second TP at 1.1201
Final TP at 1.1055 for extended downside moves
⚠️ Important Notes for Traders:
✔ Wait for Confirmation: Don’t rush into a short trade. Look for a strong bearish candle closure or a retest before entering.
✔ Be Aware of News Events: Economic releases, interest rate decisions, and major USD-related news can impact price movement.
✔ Monitor Market Sentiment: If USD strengthens, this setup is even more likely to play out.
🧐 Final Thoughts – High Probability Short Setup?
✅ Why This Trade Looks Strong:
The technical pattern is playing out perfectly, with a clear resistance rejection.
The risk-to-reward ratio is favorable, with well-defined entry, stop loss, and take profit levels.
The overall market structure supports a potential downside move if price continues respecting resistance.
📢 Bottom Line : If price remains below the 1.1414 resistance, this trade setup could provide an excellent opportunity for short-sellers targeting lower support levels. 🚀 Stay patient and wait for confirmation before pulling the trigger!

USDCHF Potential Short SetupUSDCHF is short on monthly, weekly as well as daily. The pair is now in a no resistance zone on weekly chart. Wait for the daily FVG to be made. Also there is FOMC tonight. Let us se if this setup gets materialized.

USDCHF LONG reboundUSDCHF Rebound until 60% fibbocci level on daily timeframe. moreover the MACD created Bullish divergence and the RSI is oversold.

USDCHF Study 1529SGT 19032025On the last round of trading, I took USDCHF and finally made a profit, after the first two rounds of losses on tradingview paper account.
Now, another opportunity came up on USDCHF, again. Should I enter?
I think, it is really risky.
I manage to be just above breakeven on tradingview, and I made a net total of +2.8R profit on Oanda mt4 with the same trades taken, after a total of 3 trades in March 2025.
Why would I continue to put myself at risk?
1st - I have exhausted USDCHF's opportunity, I feel.
Reason being, I have already traded the USDCHF in the last trade, and I managed to make a profit. What are the odds of making a profit again? One might say it's 50 50, however, it isn't.
The more something happens, the more unlikely it would happen the next round.
That's the first.
Especially when the trend and opportunity has been used up by traders who used that opportunity in the first place.
Slowly, they would be looking to move their money elsewhere, to new opportunities.
2nd - Price is at a significant level of support.
The support might not be the major of major on the higher time frame, but it is still significant because there might be traders who think they should take off all their profits and losses and take the opposite position instead, or new players could come in and decide to buy instead at the support area, we wouldn't know.
---
The thing is, just take it and get lost.
Some months you will be breakeven, or in a loss, or profit.
Take it and move.
If you are in a loss, and you want to try to take more trades to "max out your winrate", then you will only be maxing out your mental capital, as you see alot of "deaths" and "escapes", draining you out, and that's when you deviate from your trading technique, knowingly or unknowingly.
"I have already made so many mistakes, Imma make more, just to see where it would take me to. I could always restart, because this is paper trading."
Then get ready to lose in the long run, again.
I have been there done there, even in my last trading entries I done that because I wanted to max out of winrate.
why should I take 30 trades to make +2R when I could have taken 3 trades to make +2R?
It's not to say that when you take your time, and less is more approach, you will only make +2R at the end of 30 trades, but that, why would you try to max out your win rate when you will only be depleting yourself and your time and mental capital?
If you take your time, and focus on 1 to 3 trades, and take a break, you will go further, and gain more in the end, rather than trying to max out in the same amount of time, trading 10x the amount of trades.
Opportunities come and go, and most of the time, you are taking the same opportunity at the same time on multiple different pairs. And that is over trading. Dividing your full profit over multiple pairs at a time range, and you wonder why it took you 30 trades to make +2R, when you could have held onto the +2R at the beginning, after taking just 3 trades.
We shall see how this entry setup goes.
I am not going to take it, but I want to keep myself in check with how the price is moving.
This exact overtrading thing could be said on my previous trade on USDJPY. I made +2R on USDJPY, in my first trade but I lost -1R on it, on the second trade on Oanda mt4.
If I held my breath under water instead of panicking, I would have been up, +3.8R now, instead of +2.8R on Oanda mt4, and I would have been up +1.004R on tradingview paper account instead of being up +0.004R only.
1547SGT 19032025
