USDCHF short: Sellers Getting Ready to DominateAfter a strong impulse from buyers, we saw exhaustion near the highs. Price retraced to a major support zone, but instead of a strong bounce, we got a tight, controlled accumulation range.
the higher timeframe, i.e 4H is in a strong downmove
What’s interesting is the structure within that box: the breakout attempts are weak, volatility is contracting, and there’s a noticeable lack of bullish follow-through—just coiling.
Smart money doesn’t chase—they trap. This triangle near key support is exactly where larger players hide intentions behind "indecision." But to me, the silence screams. This doesn’t look like preparation for a markup—it feels like a setup for distribution under the disguise of consolidation.
I’m anticipating a sellers' takeover.
Entry Idea: Short on breakdown of triangle structure or on a faker as shown on the chart
Stop: Above false breakout wick
Target: Near 0.80408 (based on prior imbalance + clean levels below)
Risk-reward speaks for itself.
Let’s see if the tape reveals what I believe it’s been hiding in plain sight.
CHFUSD trade ideas

Daily Price Action: USDCHF Tuesday 4/29/2025In this video, we will be looking into the potential price action USDCHF.

USD/CHF Outlook: Bearish Shift ExpectedHello,
FX:USDCHF has experienced further upside, but downside is still expected. CHF maintains a stable monetary policy with a favorable risk stance, though economic data is mixed. Despite this, its safe haven status is influenced by regional factors, with a shift into bearish territory anticipated soon.
No Nonsense. Just Really Good Market Insights. Leave a Boost
TradeWithTheTrend3344

A clear break through a historically strong zone. SHORT There has been a break of a historically significant zone for this market. We know that zones, especially zones that have been tested multiple times, never go away and will always have some sort of impact on market prices when approached. We also have a Triple Top formation where the price has rejected multiple times. We can see the momentum trending downward. With that being said, prices have recovered and we are now looking for shorting opportunities as prices reach this zone where the market recently broke through. The zone once served as support and will now serve as resistance. Also there is a BIG hint in the most recent candle.. do you know what it is?
I am a long term trader.. Weekly to multi month trades. Not a professional, I only do this in my free time. So far posting on here I am 2 for 2 with my analysist. Check out my IDEAS on my profile. 3 for 3 ?
Happy Trading
-BWH

USDCHF – Bullish Target in SightUSDCHF – Bullish Target in Sight
🟢 Long Bias | 🎯 Target: 0.83056 | ⏳ Deadline: April 30
Momentum remains intact after a clean rally. With price consolidating beneath resistance, I’m watching for a push toward the 0.83056 key target.
I'm in. Will hold and add position as needed.
💡 All trades can be replayed on TradingView for confirmation.
No financial advice, just sharing my trades.
#USDCHF #ForexSetup #MarketAnalysis #GlobalHorns #TradingView

USDCHF Zigzag Corrective Rally Expected to FailThe USDCHF currency pair has been trending downward since its high on January 13, 2026. The pair follows a pattern known as a 5-wave impulse in Elliott Wave analysis. This pattern helps traders predict price movements by breaking them into distinct waves. Starting from the peak, the first wave (wave 1) saw the pair drop to 0.8965. After this decline, a brief recovery, or wave 2, pushed the price back up to 0.9196. From there, the pair resumed its downward trajectory in wave 3, which unfolded in several stages.
In wave 3, the price first fell to 0.8356, marking the end of an internal sub-wave (wave ((i))). A small bounce to 0.8583 completed wave ((ii)). The decline continued, with wave ((iii)) reaching 0.8096, followed by a slight rally to 0.8203 for wave ((iv)). The final leg of wave 3, wave ((v)), bottomed out at 0.803, wrapping up the third wave.
Currently, USDCHF is in an upward correction in wave 4, which is taking the shape of a zigzag pattern. From the low at 0.803, the pair climbed to 0.8124 in wave (i). Pair dipped to 0.8066 in wave (ii) then rose again to 0.8286 in wave (iii). A pullback to 0.8194 marked wave (iv), and the final push to 0.8311 completed wave ((a)), the first part of wave 4. Right now, the pair is experiencing a short-term pullback, called wave ((b)), correcting the rise that began on April 21, 2025. As long as the key support level at 0.8036 remains intact, USDCHF is expected to resume its upward movement soon, potentially reaching higher levels before the next major trend develops.

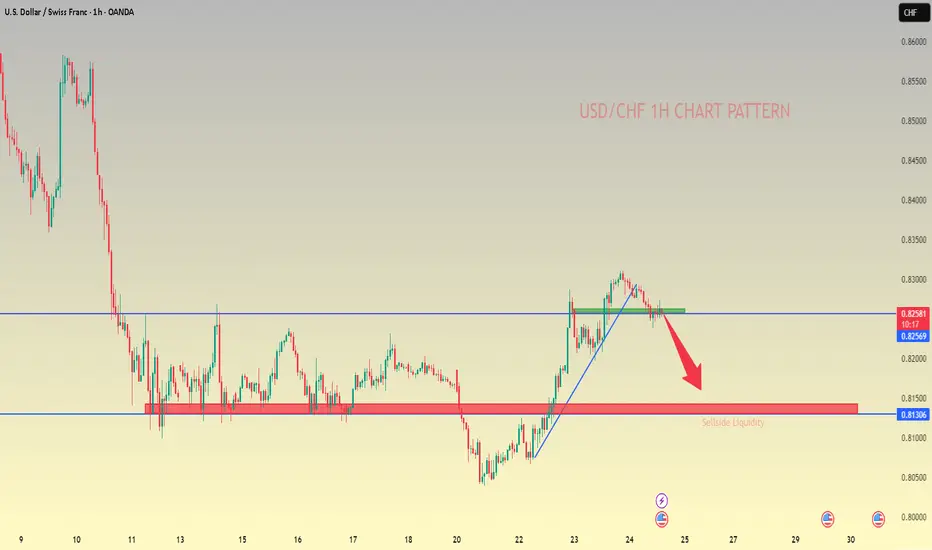
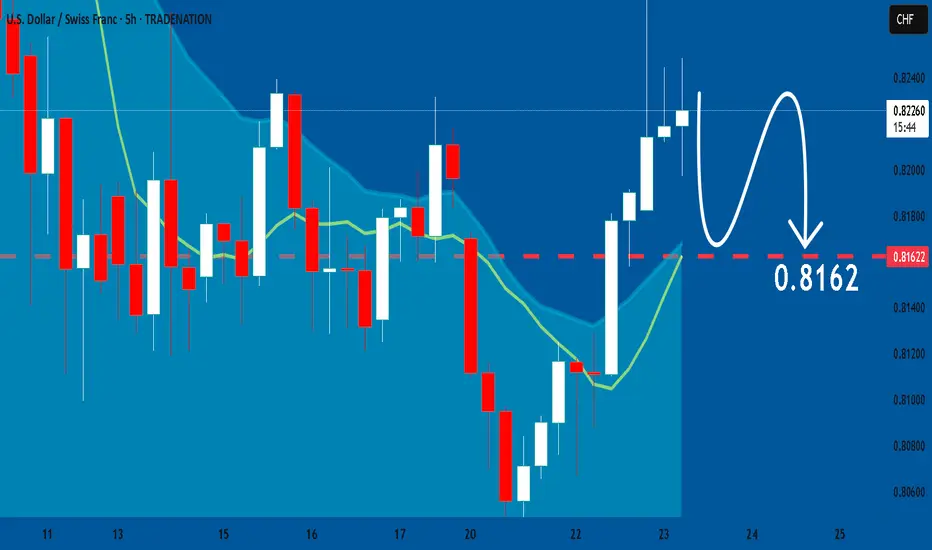
USDCHF... 1H CHART PATTERNI am considering selling **USD/CHF at 0.82529** with a **take profit (TP) at 0.82300** — that’s a short position targeting a **~22.9 pip** gain. Let's break it down quickly:
### 🔍 Trade Overview:
- **Pair**: USD/CHF
- **Position**: Sell (short)
- **Entry**: 0.82529
- **TP**: 0.82300
- **Pip Gain**: ~22.9 pips
### ✅ Considerations Before Entering:
1. **Trend**: Is USD/CHF in a downtrend on the higher timeframes (H4, D1)?
2. **Support Area**: 0.82300 — does this align with a recent support zone?
3. **News/Events**: Any CHF or USD news coming up? (Like SNB or Fed speakers, inflation, etc.)
4. **Volume & Momentum**: Is momentum currently bearish? Look at RSI/Volume or MACD if you're using indicators.
5. **Stop Loss**: What’s your SL? Risk-reward is key — ideally at least 1:1.
### 🔒 Risk Management:
If you don’t have a stop loss yet, maybe set one above the recent swing high (like 0.82650 or above depending on market structure).
USDCHF in bullish trendThe pair has given a breakout and is making a bullish rally.The movement and the buying support indicate that it is going upwards while breaking the lower highs.

Daily Price Action: USDCHF Wednesday 4/23/2025In this video, we will be looking into the potential price action of USDCHF.

USDCHF BULLISHTrade Setup Details for USD/CHF (4H Chart)
Overview
Pair: USD/CHF (US Dollar / Swiss Franc)
Timeframe: 4H (4-hour chart)
Date of Analysis: April 23, 2022
Current Price: 0.82920 (as shown on the chart)
Market Sentiment: Bullish (indicated by "Bullish Divergence" on the RSI)
Trade Setup
Trade Type: Buy
Entry Point: 0.82792
The entry is marked just above the recent low, suggesting a potential reversal after the price broke below a descending trendline and retested a key support zone around 0.82790–0.82960.
Stop Loss: 0.80312
The stop loss is placed below the recent swing low, providing a buffer against further downside. This gives a risk of approximately 248 pips from the entry point.
Take Profit: 0.85265
The take profit is set at a key resistance level, aligning with previous highs around 0.85265. This offers a potential reward of approximately 247 pips from the entry point.
Risk-to-Reward Ratio: Approximately 1:1 (247 pips reward / 248 pips risk)
Technical Analysis
Price Action: The price has been in a downtrend, as indicated by the descending trendline. However, a break below this trendline followed by a retest suggests a potential reversal. The price is now approaching a key support zone between 0.82790 and 0.82960.
Support/Resistance:
Support: 0.82790–0.82960 (recent price action shows a bounce from this zone).
Resistance: 0.85265 (previous high, marked as the take profit level).
Indicators:
RSI (Relative Strength Index): The RSI is at 52.61, showing neutral momentum. However, a "Bullish Divergence" is noted, where the price made a lower low, but the RSI formed a higher low, indicating weakening bearish momentum and a potential reversal.
The RSI is also trending upward, supporting the bullish outlook.
Trendline: The descending trendline (drawn on the chart) has been broken, and the price is retesting this breakout area, which often acts as support after a breakout.
Trade Rationale
The setup is based on a combination of price action and technical indicators:
The break of the descending trendline suggests the downtrend may be losing steam.
Bullish divergence on the RSI indicates a potential reversal, as momentum shifts in favor of buyers.
The price is approaching a key support zone, which has historically held, increasing the likelihood of a bounce.
The take profit at 0.85265 aligns with a significant resistance level, providing a logical target for the trade.
Risk Management
The stop loss at 0.80312 ensures that the trade is invalidated if the price continues to decline significantly, protecting against larger losses.
Traders should consider position sizing to ensure the 248-pip risk aligns with their risk tolerance (e.g., risking 1–2% of their account on this trade).
Additional Notes
Monitor for confirmation of the reversal, such as a strong bullish candlestick pattern (e.g., engulfing or pin bar) at the support zone.
Be cautious of any fundamental news (e.g., US or Swiss economic data) that could impact USD/CHF volatility during the trade.

USDCHF INTRADAY bearish below 0.8300Recent price action in USDCHF suggests an oversold bounce, with resistance capping gains at the 0.8300 level.
The continuation of selling pressure could extend the downside move, with key support levels at 0.8090, followed by 0.8040 and 0.7940.
Alternatively, a confirmed breakout above 0.8300, accompanied by a daily close higher, would invalidate the bearish outlook. In this scenario, USDCHF could target 0.8365, with further resistance at 0.8450 and 0.8520.
Conclusion:
The price remains below pivotal level, with 0.8300 acting as a key resistance. Failure to break above this level could reinforce downside risks, while a breakout could shift momentum back in favour of bulls. Traders should watch for confirmation signals before positioning for the next move.
This communication is for informational purposes only and should not be viewed as any form of recommendation as to a particular course of action or as investment advice. It is not intended as an offer or solicitation for the purchase or sale of any financial instrument or as an official confirmation of any transaction. Opinions, estimates and assumptions expressed herein are made as of the date of this communication and are subject to change without notice. This communication has been prepared based upon information, including market prices, data and other information, believed to be reliable; however, Trade Nation does not warrant its completeness or accuracy. All market prices and market data contained in or attached to this communication are indicative and subject to change without notice.


USDCHF: Bearish Forecast & Bearish Scenario
Balance of buyers and sellers on the USDCHF pair, that is best felt when all the timeframes are analyzed properly is shifting in favor of the sellers, therefore is it only natural that we go short on the pair.
Disclosure: I am part of Trade Nation's Influencer program and receive a monthly fee for using their TradingView charts in my analysis.
❤️ Please, support our work with like & comment! ❤️
USDCHF - LONG - BULLISH DIVERGENCEAs you can see that usdchf have bullish divergence at H4 and i am waiting to breakout if that happend and i will find for the small resistance to TP
i put SL inside their consolidation.
Entry: 0.8312
TP: 0.856
SL : 0.818

Short term 99.9 accurate usdchf sell tradeThe wxy correction has completed and the dollar weakness has resumed.

USDCHF Swing UpdateUSDCHF has officially broken out of the 0.82485 consolidation zone. Based on structure and momentum, we could be seeing a deeper pullback toward 0.83366, which has been a key level historically and would make sense for retesting the bearish structure.
If price fails to reach that level or rejects sooner, I’ll be watching for continuation setups below 0.81394 and 0.80464. A clean break and retest of either would offer strong selling opportunities targeting 0.70517 for a longer-term swing setup.
Momentum remains bearish, so staying patient for high-quality entries is key.

USD/CHF "The Swissy" Forex Market Heist Plan Bearish (Swing/Day)🌟Hi! Hola! Ola! Bonjour! Hallo! Marhaba!🌟
Dear Money Makers & Robbers, 🤑💰✈️
Based on 🔥Thief Trading style technical and fundamental analysis🔥, here is our master plan to heist the USD/CHF "The Swissy" Forex Market. Please adhere to the strategy I've outlined in the chart, which emphasizes short entry. Our aim is the high-risk Green Zone. Risky level, oversold market, consolidation, trend reversal, trap at the level where traders and bullish robbers are stronger. 🏆💸"Take profit and treat yourself, traders. You deserve it!💪🏆🎉
Entry 📈 : "The vault is wide open! Swipe the Bearish loot at any price - the heist is on!
however I advise to Place sell limit orders within a 15 or 30 minute timeframe most nearest or swing, low or high level for Pullback Entries.
Stop Loss 🛑:
📌Thief SL placed at the nearest/swing High or Low level Using the 4H timeframe (1.81400) Day/Swing trade basis.
📌SL is based on your risk of the trade, lot size and how many multiple orders you have to take.
Target 🎯: 1.79300 (or) Escape Before the Target
💰💵💸USD/CHF "The Swissy" Forex Market Heist Plan (Swing/Day Trade) is currently experiencing a Bearish trend.., driven by several key factors.👇👇👇
📰🗞️Get & Read the Fundamental, Macro, COT Report, Quantitative Analysis, Sentimental Outlook, Intermarket Analysis, Future trend targets with Overall outlook score... go ahead to check 👉👉👉🔗🔗
⚠️Trading Alert : News Releases and Position Management 📰 🗞️ 🚫🚏
As a reminder, news releases can have a significant impact on market prices and volatility. To minimize potential losses and protect your running positions,
we recommend the following:
Avoid taking new trades during news releases
Use trailing stop-loss orders to protect your running positions and lock in profits
💖Supporting our robbery plan 💥Hit the Boost Button💥 will enable us to effortlessly make and steal money 💰💵. Boost the strength of our robbery team. Every day in this market make money with ease by using the Thief Trading Style.🏆💪🤝❤️🎉🚀
I'll see you soon with another heist plan, so stay tuned 🤑🐱👤🤗🤩

USDCHF INTRADAY bearish below 0.8270The USDCHF pair is exhibiting a bearish sentiment, reinforced by the ongoing downtrend. The key trading level to watch is at 0.8270, which represents the current intraday swing high and the falling resistance trendline level.
In the short term, an oversold rally from current levels, followed by a bearish rejection at the 0.8270 resistance, could lead to a downside move targeting support at 0.8040, with further potential declines to 0.7970 and 0.7900 over a longer timeframe.
On the other hand, a confirmed breakout above the 0.8270 resistance level and a daily close above that mark would invalidate the bearish outlook. This scenario could pave the way for a continuation of the rally, aiming to retest the 0.8344 resistance, with a potential extension to 0.8424 levels.
Conclusion:
Currently, the USDCHF sentiment remains bearish, with the 0.8270 level acting as a pivotal resistance. Traders should watch for either a bearish rejection at this level or a breakout and daily close above it to determine the next directional move. Caution is advised until the price action confirms a clear break or rejection.
This communication is for informational purposes only and should not be viewed as any form of recommendation as to a particular course of action or as investment advice. It is not intended as an offer or solicitation for the purchase or sale of any financial instrument or as an official confirmation of any transaction. Opinions, estimates and assumptions expressed herein are made as of the date of this communication and are subject to change without notice. This communication has been prepared based upon information, including market prices, data and other information, believed to be reliable; however, Trade Nation does not warrant its completeness or accuracy. All market prices and market data contained in or attached to this communication are indicative and subject to change without notice.

usd/chf short USD/CHF SHORT "break of a support area and retest it + 50% fib retracement + 50 ema dynamic resistance "

USDCHF Weekly Chart Long Positions AB=CD+ BBUSDCHF Weekly Chart Long Positions AB=CD+ BB
Price is also on Fibo E level support + RSI on 23 and Sto on 5.5
And more tools show this is the turning point

USD/CHF Collapses to Fresh Decade+ Lows – Oversold?The U.S. dollar continues to slide against the Swiss franc, with USD/CHF falling below 0.8100 and hitting its lowest level since 2015. The technical picture remains heavily bearish:
📉 Price is well below the 50- and 200-day SMAs
⚠️ RSI is deeply oversold at 26.21, but showing no bullish divergence yet
📉 MACD is accelerating to the downside, confirming downside momentum
🔻 Support at 0.8400 was shattered and may now act as resistance
While a short-term bounce could emerge due to oversold conditions, the downtrend remains firmly intact. A close below 0.8075 opens the door to a potential test of the psychological 0.8000 handle.
-MW

Institutional Demand: USD/CHF longsHey,
Another beautiful pullback play is likely for many USDs this week.
NU, GU, EU etc are all in or near value.
Together with USD/CHF also moving towards a key area of value.
I'll patiently wait till price reaches it and then look for our 4-hour confirmation.
Kind regards,
Max Nieveld

check the trendThe downtrend is expected to continue until the specified support levels are formed. Then there is a possibility of a trend change.
