CHZ Weekly AnalysisCHZ Weekly Analysis
CHZ is showing a positive divergence on the weekly timeframe, indicating a possible bullish move.
Risk-tolerant traders may start entering at the current price, placing their stop-loss below the weekly support zone, and considering an additional entry around the weekly support.
H

CHZ LIMIT FOR BUY(FREE)Hello friends
Due to the price drop, we can buy on the drop within the specified limits and move with it to the specified targets, of course with capital and risk management.
*Trade safely with us*

Bullish Technical Analysis for CHZ/USDT📈 **Bullish Technical Analysis for CHZ/USDT**
Current Price: **0.04161 USDT**
✨ CHZ shows signs of strengthening its bullish trend after surpassing the key resistance level at **0.04500 USDT**.
🎯 **Potential Bullish Targets:**
1️⃣ **0.06300 USDT**
2️⃣ **0.11511 USDT**
🔍 Indicators:
- *

CHZ 50x plus tradeTraders,
Here we are again pointing out an amazing trade idea for you, the solicitors 👧🏿 and dealers 🙍🏿♂️who will likely end up transacting all of your winnings with! CHZ a great wagering project that will make you a killing this run. This one is cut and dry, we have a wedge pattern along with a

#CHZ/USDT#CHZ
The price is moving within a descending channel on the 1-hour frame, adhering well to it, and is on its way to breaking it strongly upwards and retesting it.
We are seeing a bounce from the lower boundary of the descending channel, which is support at 0.03470.
We have a downtrend on the RSI i

Chiliz: Your Altcoin ChoiceChiliz (CHZUSDT) can break $1 on a strong bull-market. To reach $3, we would need an extra-ordinary bullish wave and this target seems less likely, but still possible...
How are you doing my cherished reader?
I hope you are having a wonderful day.
This a great chart. Chiliz hit a new All-Time Low

Some of you won't be able to holdWeekly stoch RSI crossed bullish. It's the weekly, some more downturns can be had. But are you waiting to time this? Seriously?
Check out my other CHZ ideas for different views on this coin.
Will you be able to hold till the top? It might come within 3 months.
Rustle

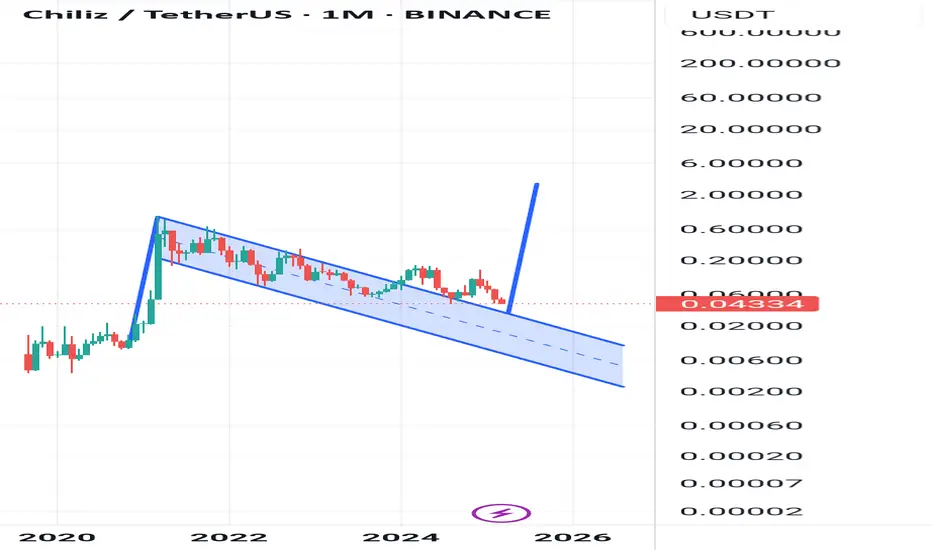
Chiliz Technical AnalyzeTrend: Chiliz is in a descending channel (red lines), and price is currently approaching the lower boundary, which could act as support.
Support: The green zones around 0.042 and 0.022 represent important support levels, with the latter acting as a critical point to maintain the current trend.
Res

Will this same bars pattern on CHZ repeat?Welcome back dear reader, for another Chilliz post.
As i've been analyzing the chart further my eye fell on the bars pattern from May till October 2020, and noticed that it looks ALOT like the current bars pattern.
The market structure it would form would also make alot of sense from a traders pe

Have you considered this alternative?Chiliz (CHZ) leads innovation in fan engagement with their favorite teams through blockchain technology. Its platform enables the creation of Fan Tokens that offer users exclusive access to experiences and decisions related to sports clubs, eSports teams, and more.
Chz has been trading in a massiv
See all ideas
Summarizing what the indicators are suggesting.
Oscillators
Neutral
SellBuy
Strong sellStrong buy
Strong sellSellNeutralBuyStrong buy
Oscillators
Neutral
SellBuy
Strong sellStrong buy
Strong sellSellNeutralBuyStrong buy
Summary
Neutral
SellBuy
Strong sellStrong buy
Strong sellSellNeutralBuyStrong buy
Summary
Neutral
SellBuy
Strong sellStrong buy
Strong sellSellNeutralBuyStrong buy
Summary
Neutral
SellBuy
Strong sellStrong buy
Strong sellSellNeutralBuyStrong buy
Moving Averages
Neutral
SellBuy
Strong sellStrong buy
Strong sellSellNeutralBuyStrong buy
Moving Averages
Neutral
SellBuy
Strong sellStrong buy
Strong sellSellNeutralBuyStrong buy
Displays a symbol's price movements over previous years to identify recurring trends.