CKB - Nervos NetworkReal nice Bullish Dragon here with a Right angled and descending broadening formation as a base. Pattern target would be a 100% measured move of the range

#CKB/USDT — The Final Defense Zone Before a Major Move?#CKB
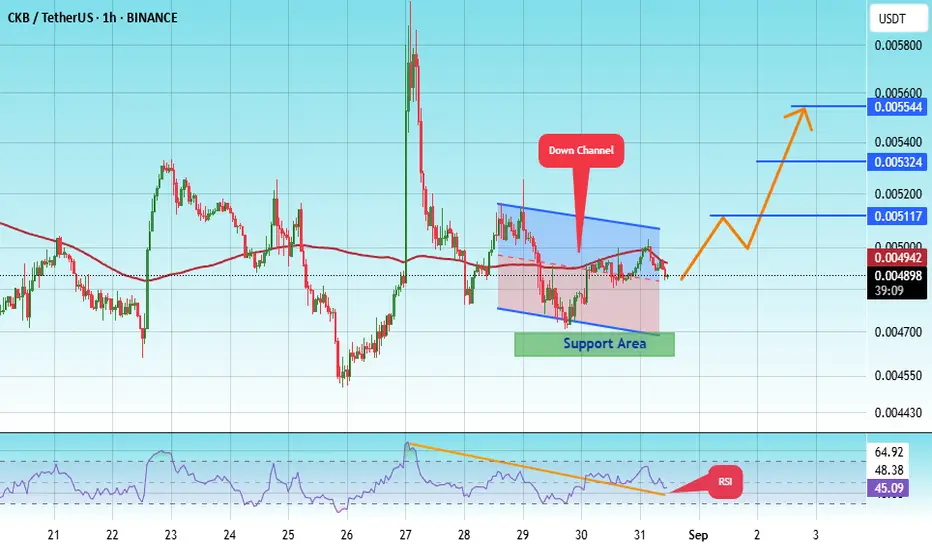
The price is moving in a descending channel on the 1-hour timeframe and is expected to break out and continue upwards.
We have a trend to stabilize above the 100-period moving average again.
We have a downtrend on the RSI indicator, which supports an upward move if it breaks above it.
We ha

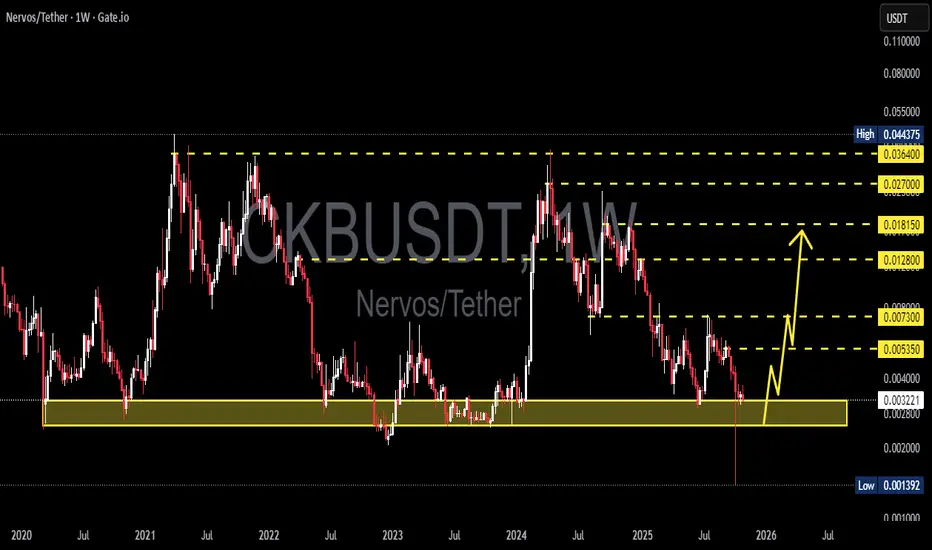
CKB/USDT — The Final Defense Zone Before a Major Move?CKB is currently standing on its last line of defense, the historical support zone between 0.0032–0.0025, which has served as the foundation of every major reversal since 2020.
For over three years, this yellow block has acted as the core accumulation zone where long-term buyers consistently regaine
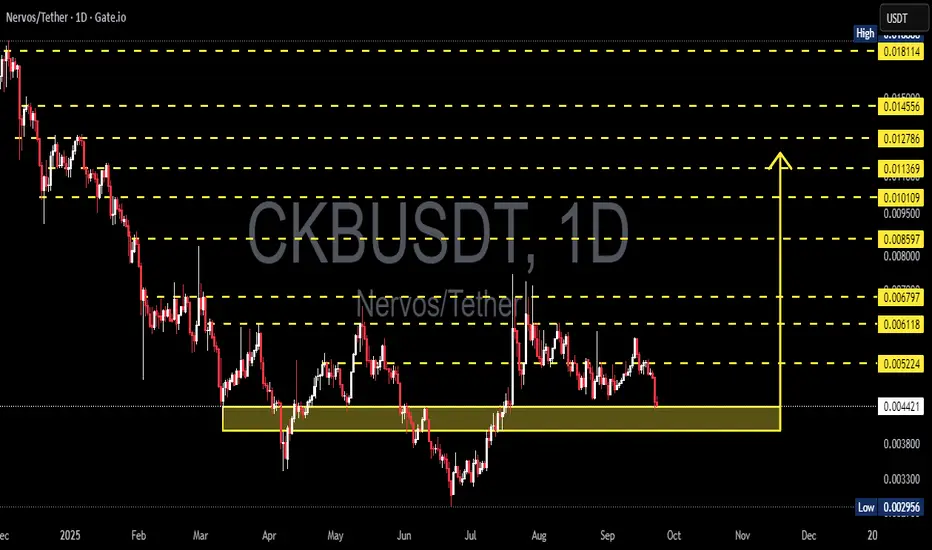
CKBUSDT 3D#CKB is moving inside a descending channel on the 3-day timeframe chart and is currently holding above the support zone. In case of a bounce and breakout above the channel resistance, the potential targets are:
🎯 $0.004782
🎯 $0.006410
🎯 $0.008548
🎯 $0.010276
🎯 $0.012004
🎯 $0.014464
🎯 $0.017598
⚠️

CKBUSDT — Test Demand Zone: Reversal or Deeper Breakdown?📝 Full Analysis
The Nervos (CKB/USDT) pair is now trading right inside a critical demand zone at 0.0038 – 0.0046. This area has repeatedly acted as a last line of defense against deeper declines. At this stage, the market is at a decision point: will this zone trigger another accumulation bounce, o
BUY. CKB. NOW0.2 is coming now
As my post from 2023 states
0.19-20 is the final target
This year it will happen
All the math finally adds up

CKB 0.05 THIS YEAR?if we had 3 rate cuts this year instead of 2
CKB making new all time high to 0.045-0.05 is possible by end of the year
DYOR

#CKB/USDT Still Time to Catch the Move? Some say the move ?#CKB
The price is moving within a descending channel on the 1-hour frame, adhering well to it, and is heading for a strong breakout and retest.
We have a bearish trend on the RSI indicator that is about to be broken and retested, supporting the upside.
There is a major support area (in green) at
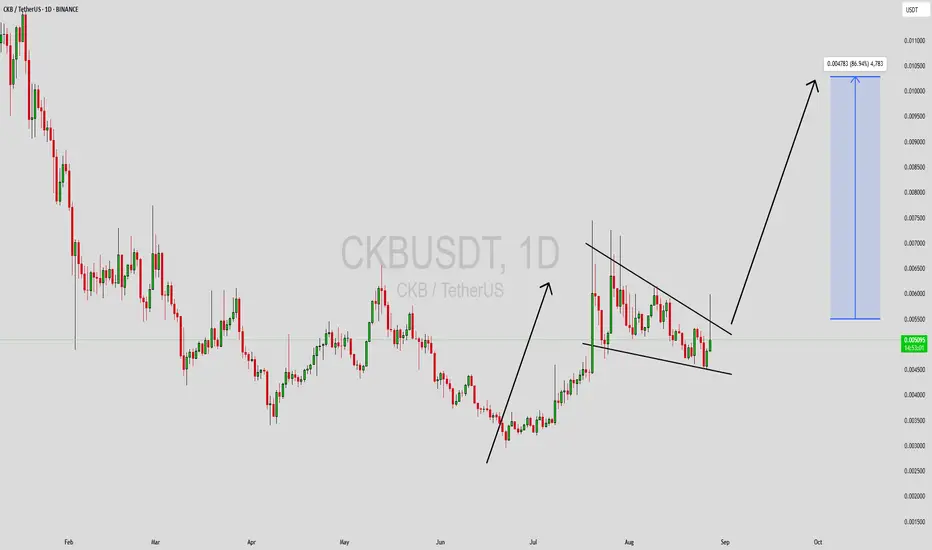
CKBUSDT 1D#CKB has formed a falling wedge pattern on the daily chart. The SMA100 is acting as an additional layer of support. If it breaks out above the pattern resistance, the potential targets are:
🎯 $0.005539
🎯 $0.006175
🎯 $0.006690
🎯 $0.007204
🎯 $0.007936
🎯 $0.008869
⚠️ As always, use a tight stop-loss

CKBUSDT Forming Falling WedgeCKBUSDT is showing a falling wedge pattern, which is widely regarded as a bullish reversal signal in technical analysis. After a period of steady downward pressure, the price has begun to compress within narrowing trendlines, signaling that selling momentum is weakening while buyers are quietly step
See all ideas
Summarizing what the indicators are suggesting.
Oscillators
Neutral
SellBuy
Strong sellStrong buy
Strong sellSellNeutralBuyStrong buy
Oscillators
Neutral
SellBuy
Strong sellStrong buy
Strong sellSellNeutralBuyStrong buy
Summary
Neutral
SellBuy
Strong sellStrong buy
Strong sellSellNeutralBuyStrong buy
Summary
Neutral
SellBuy
Strong sellStrong buy
Strong sellSellNeutralBuyStrong buy
Summary
Neutral
SellBuy
Strong sellStrong buy
Strong sellSellNeutralBuyStrong buy
Moving Averages
Neutral
SellBuy
Strong sellStrong buy
Strong sellSellNeutralBuyStrong buy
Moving Averages
Neutral
SellBuy
Strong sellStrong buy
Strong sellSellNeutralBuyStrong buy
Displays a symbol's price movements over previous years to identify recurring trends.