MBT1! trade ideas

$BTC futures vs spot, make or break for CryptoSpot CRYPTOCAP:BTC looks different when it is compared to Futures #BTC
#Bitcoin is struggling here, no doubt
We also have to consider that TVC:DXY has been selling off decently
The yellow dotted area is going to make or break #crypto

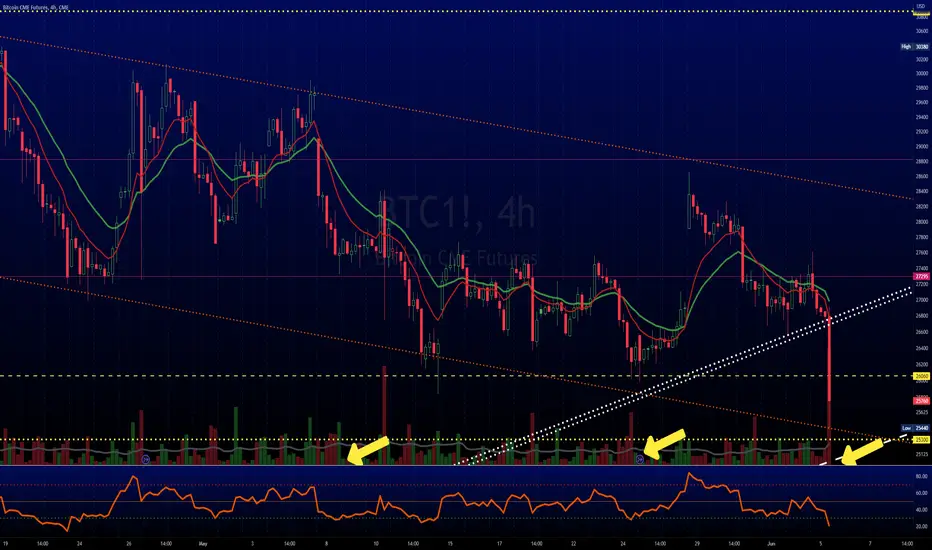
$BTC @ do or die levels, Bull can still be alive but hurtingCRYPTOCAP:BTC has been @ #2 for a while now
There's nothing to see on the 4Hr chart so went to 1HR
We're beginning to see POSITIVE Divergence on the Relative Strength Index
(Date that is important)
The 25kish area for #BTC is VERY IMPORTANT
If #Bitcoin closes under it that's not good
Could go as low as the Gap Fill
Shorts have tons of ammo if they need it
#crypto


BTC CME futures makes me expect more dumpingI had these levels from weeks ago, I had highlighted the liquidity gaps, first one was already filled but the next one it's a big one which includes a classic liquidity gap + a gap created by CME closure.
Historically speaking the closing gaps are always filled, moreover the zone over that it's basically a liquidity gap on daily, on the 4h it contains 2 different liquidity gaps.
I keep being bearish because, despite people calling the bottom in I don't see much bullishness around, however I suggest everyone to find what you wanna buy and start DCAing because, for experience, you recognize the bottom when it's too late!

BTC Head and Shoulder PatternBTC did a right shoulder rejection and respecting the logarithmic downward trend line. Also, if stock market and tech starts to give out - crypto will follow in the rinse. The news is rather bearish around BTCUSD with SEC filings.

Imbalance or Gap Fill?We have 2 main supports - the 24.2k imbalance and the CME gap fill here
Let's find out where we land on. Currently im short from the 27k's.

Short 26000 05.05.2023 (eng)Any phase of the market, no matter how long it lasts, ends
A hell of a long and exhausting trade
The time has finally come.
I opened Short of 05.05.2023 18.59 at the price of 26.000
The previous Long of 06.01.2023 closed at +53% without the use of leverage
Let's see what surprises the market is preparing for us this time

It's about POWER, not regulation, $BTC still in pattern!!!Haven't seen 1 account speak on what we've said for about 2 years now, in reference to gov & #CBDC and them not liking competition
NOT 1
Many #CEXs have asked for guidance & what have they received? NOTHING!
This is NOT about #crypto protection!
This is about CONTROL!
#DEX #BTC #GOLD #SILVER
ANYWAY
CRYPTOCAP:BTC still looks good.
Pattern we highlighted some time ago is STILL in PLACE.
Picked some #BTC up after hours last night.
Check the BUYS on 4Hr chart.
Shorts were not heavy so this is outright BUYING!
#Bitcoin still looks good imo!
#crypto

$BTC - Cup and Handle?Yes, bitcoin prices have dropped but it is moving along nicely with our handle... just saying... do you guys see something different? Please share!

Bitcoin Flag!CME:BTC1!
CRYPTOCAP:BTC is printing a falling wedge on 1D and looks like possible retest at pullback area 25.2k.
On the 12h the wedge looks like a bearish retest of the Head & Shoulders which can be viewed here: tinyurl.com
You don't have to be in a trade. Let Price show you and execute your edge.
Waiting for direction with Plan A Plan B in place.
Potential for:
Long:
Breakout of wedge with target to 31k
Bullish Retest of 25.2k zone
Short:
Bearish Retest of 25.2k with possible target to 21.5k area near the Gap between 20330 and 21110
Breakdown of current level and bearish retest for move to and breakdown of 25.2k level.
200D MA must hold to prevent further downside.
Always having Plan A and Plan B scenarios so we can react once the markets provide an opportunity to execute our edge.
If you liked this idea or if you have your own opinion about it, write in the comments.
The information and publications are not meant to be, and do not constitute, financial, investment, trading, or other types of advice or recommendations.

$BTC drop has been expected, 4Hr oversold, bounce soon?CRYPTOCAP:BTC has decent sell volume, AGAIN
Sell volume COULD be waning for the moment
Best to keep an eye on the pattern & the buys
#BTC 4Hr is pretty oversold
#bitcoin shorts covered end of May but there's a slight bump atm
#Crypto
HOW PRICE OF BITCOIN WOULD REACH FOR $34KPrice takes out the Buyside Liquidity on Tuesday and now heading for the Sellside Liquidity.
Whenever price takes a Liquidity, there is always a Higher time frame PDArray that it directly trade off from and that is the Bullish OrderBlock
I want to see price of Bitcoin to take off to $34k from the Bullish OrderBlock
Take a Look at my previous analysis on Bitcoin


$BTC still looks okay, IMO don't listen to naysayersMany are saying #crypto doesn't look good
We've called almost every top & bottom this year, so far, & Some have been almost to the hour
IMO #cryptocurrency looks okay and is experiencing a NORMAL correction
CRYPTOCAP:BTC stuck between 2 trends atm
Which one will win?
If #1 breaks #BTC is @ 25k
#bitcoin sells have been more recently but nothing out of ordinary


Bitcoin Head & Shoulders Still in Play!CME:BTC1!
CRYPTOCAP:BTC is still in the head and shoulders.
My original idea was posted on this link: tinyurl.com and can be referred to.
Price Action is printing a downward channel providing ideas for a possible retest at the 25.2k zone.
But the price action stays in the pattern until break of structure.
Plan A: Short to 24k and possibly 21k ... (you could possibly get higher entries if the price is going sideways).
Plan B: Long on successful retest with first target to 31k and on successful SR Flip to 45/48k!!
Step by step - let the price come to you at an area of value and enter on trigger.
Always having Plan A and Plan B scenarios so we can react once the markets provide an opportunity to execute our edge.
If you liked this idea or if you have your own opinion about it, write in the comments.
The information and publications are not meant to be, and do not constitute, financial, investment, trading, or other types of advice or recommendations.

BTC CME 29000Hello, friends! I want to share the latest news about BTC. Today, a gap was closed on CME (Chicago Mercantile Exchange). Currently, the market is developing according to expectations and the scenario of closing this gap.
The levels that remain relevant at the moment are 29000 and 34440 on the upside, as well as 20300 on the downside. It is within this range that my limit orders are set.

BTC CME GAP UPDATE! UNFILLED CME GAP AT $20K....Hello everyone, if you like the idea, do not forget to support it with a like and follow.
Welcome to this BTC CME update. Before moving further we must know what is CME gap and how it works. So let's try to understand it first.
What is CME Gap?
A CME gap for bitcoin refers to a price discrepancy that occurs on the Chicago Mercantile Exchange bitcoin futures chart between the closing price of one trading day and the opening price of the next trading day.
How to identify CME Gap?
Look at the chart carefully, you will see that last Friday on 26th May Price closes around FWB:27K and after that on 30th May Price opens at $27.8k which will leave a gap in the chart and yesterday we filled this gap.
Now our big question is whether all CME Gaps are filled or not. These CME gaps have a tendency to get "filled” – meaning that the market corrects back into the gap. While sources struggle to agree on the exact percentage, most of them agree that at least 60-70% of CME gaps are filled eventually.
So according to the chart, we have filled our recent CME Gap which is around the $26.8k level so there is a chance that we might see a relief rally now up to the $28k- FWB:29K from here.
But we also have a huge Gap left around $20k which might be filled sooner or later imo.
Hope this update will clear all your doubts about the CME GAP.
What do you think about this $20k Unfilled CME Gap?
Do you also think that we filled this gap sooner or later or do you think that we left it unfilled?
Share your views in the comment section.
If you like this idea then do support it with like and follow.
Thank You!

BTC filled current CME gap now what!BTC traded down and almost filled the current CME GAP...this is the best Area for BTC to pump from...if BTC started to pump then we might see it go up for another CME GAP...on 1st June U.S have debt ceiling date...if debt ceiling is raised then we'll see the market turns green..

Bitcoin CME Futures Gap Filled!Traders,
One more negative indicator has been eliminated. You'll remember that in yesterday's post I pointed out this gap created a couple of days ago. 99% of all gaps are filled, and they are usually filled sooner rather than later. To have our gap to the downside filled so quickly is rather bullish IMO. We now have a new pivot high on our daily charts on Bitcoin as well as many/most altcoins, and we are forming what appears to be bull flags on many of these same charts.
Stay tuned as always. You know where to follow me for all the latest trades. I don't always post everything here.
Stew

$BTC - Weekly (Potential Cup and Handle)I know, I know... I am quite wary of anything crypto, even the King of Crypto CRYPTOCAP:BTC but in analyzing the chart, there may be a potential Cup and Handle formation forming with a price target of 47,000.
Recall that CRYPTOCAP:BTC halves every four years and the next halving cycle is 2024.
Happy trading!

BTC CME GAP 30/5/2023There's a CME gap between 27900 - 27000. If u hv long order on hand, Move SL to Breakeven.
If you have short order can consider take profit 30-50% at this zone.
