May 2nd Trade Journal & Stock Market Analysis** May 2nd Trade Journal & Stock Market Analysis**
EOD accountability report: +821
Sleep: 6 hour, Overall health: :thumbsup:
Another great day in the market, Signals worked decent.
**Daily Trade recap based on VX Algo System**
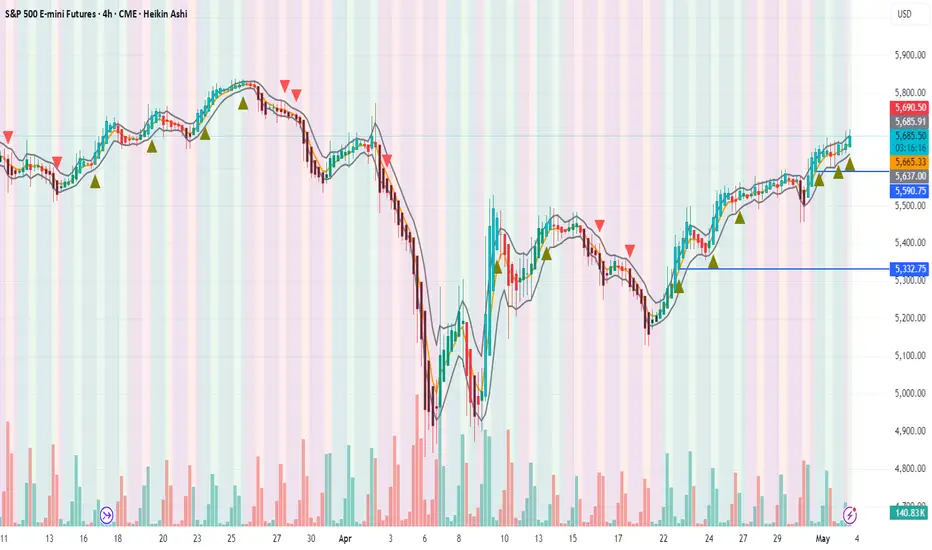
— 12:50 PM VXAlgo ES X1 Sell Signal :check:
— 1:12 PM VXAlgo ES X3 Sell Signal :x:
— 3:30 PM Market Structure flipped bearish on VX Algo X3! :check:
Next day plan--> Over 5650 = Bullish, Under 5650 = Bearish
Video Recaps -->https://www.tradingview.com/u/WallSt007/#published-charts
ESM2021 trade ideas

How to Place Different Types of Futures Orders on TradingViewThis tutorial video walks you through how to place basic futures orders on tradingview including market, limit, and stop orders.
We also discuss bracket orders, modifying orders, and cancelling orders, as well time of order effect.
There is a substantial risk of loss in futures trading. Past performance is not indicative of future results. Please trade only with risk capital.


$IZM = China Semiconductor Name. $NVDA $AMD $SMCI $SMH $SOXLNASDAQ:IZM = China Semiconductor Name.
This Thing Can Move Like It Did 1 Year Ago.
With All of The Trouble NASDAQ:NVDA NASDAQ:AMD NASDAQ:SMCI NASDAQ:SMH Are Dealing with Tariffs.
This Is A Work Around.
ICZOOM Group, Inc. is an offshore holding company, which engages in conducting operations in China through its subsidiaries and engages in the sales of electronic component. It mainly does business through e-commerce trading platforms and sells two categories of electronic component products-semiconductor products and electronic equipment, tools and other products. The company semiconductor products primarily include various integrated circuit, discrete, passive components, optoelectronics, and equipment, tools and other electronic component products primarily include various electromechanical, maintenance, repair & operations (“MRO”), and various design tool. Its products are widely used by SMEs in the consumer electronic industry, Internet of Things (“IoT”), automotive electronics and industry control segment. The company also provides services to customers such as temporary warehousing, logistic and shipping, and customs clearance. The company was founded by Lei Xia and Duan Rong Liu on June 23, 2015 and is headquartered in Shenzhen, China.

BUYS For the Markets. Wait for BUYS in Gold and Silver.In this video, we will analyze the S&P 500, NASDAQ, DOW JONES, Gold and Silver futures, for the week of May 5 - 9th.
The Indices are moving higher, and it's buys until they are not. Simple.
Gold is near potential support at 3201. This may present a great buying opportunity once the lows are swept. A weakened USD will help this cause.
Silver has made a bearish market structure shift (MSS), so buys are not yet on the table. If it disrespects a Daily -FVG, then sells are warranted. It is considerably weaker than Gold.
Enjoy!
May profits be upon you.
Leave any questions or comments in the comment section.
I appreciate any feedback from my viewers!
Like and/or subscribe if you want more accurate analysis.
Thank you so much!
Disclaimer:
I do not provide personal investment advice and I am not a qualified licensed investment advisor.
All information found here, including any ideas, opinions, views, predictions, forecasts, commentaries, suggestions, expressed or implied herein, are for informational, entertainment or educational purposes only and should not be construed as personal investment advice. While the information provided is believed to be accurate, it may include errors or inaccuracies.
I will not and cannot be held liable for any actions you take as a result of anything you read here.
Conduct your own due diligence, or consult a licensed financial advisor or broker before making any and all investment decisions. Any investments, trades, speculations, or decisions made on the basis of any information found on this channel, expressed or implied herein, are committed at your own risk, financial or otherwise.

Are We Close Making Third Lower High ?Staying long XLF SPY UVXY Short MAGS IWM
Have my hedges on be ready a drop can happen anytime 565 target can we get their
Will know by Friday Big Earnings This Week.

04/28 Weekly GEX AnalysisDETAILED IMAGE:
Here’s what the charts and indicators are showing right now until Friday.
We are approaching a key breakout zone.
🐂 🟢 IF the market breaks above the white bearish daily trendline, the next bullish target could be between 5515–5680.
🟦 ⚖️ The chop area is between 5435–5515.
Expect more back-and-forth moves here if the breakout fails.
🐻🔴 Watch out: if the price drops below 5435 or 5425, there’s little support left.
This could trigger a sharp sell-off ("Bearish Armageddon" scenario).
GEX profiles remain positive 🟢 across all near expirations — for now — suggesting that underlying support still exists, but we need to monitor any changes closely.
IVRank is still relatively high (30.9), meaning options are priced with a decent amount of implied volatility.
🟢Short-term sentiment is currently bullish, with some speculative activity picking up.
This suggests that traders are expecting less volatility over the next month compared to what we saw in the past week.
However, if we look at institutional positions focused on longer-term expirations (especially beyond 30 days on SPX/AM maturities), the picture remains bearish 🔴 or at least highly volatile.
These players are still strongly hedging against downside risks.
This confirms the broader point:
Even though price action managed to recover to pre-tariff-announcement levels — with very low trading volume — we’re not out of the woods yet.
Until we can break and hold above the key resistance bearish trend with HIGH BUY VOLUME (aka. momentum), we shouldn't expect a strong, stable GEX profile across all expirations like we had in the past.

A buying boost?In the S&P 500 daily chart the structure implies buying has returned to this market in Asia is a bit stronger. So, is this price action that were seen a buying boost? If it is, the expectation is a positive close above 5670.

Dow Jones - April ReviewUnlike ES and NQ, YM has the potential to book massive gains if the algorithm was to spool prices higher into the $42,836 lower range FVG in comparison to the others. However, if the market is weaker than many anticipate, YM could be frontrunning the overall stock index pairs (out of NQ, ES and YM) to the downside.
Gun to my head, we are bound for some short term bullish price action back up into the premium array

S&P 500 - April ReviewI see more potential in S&P 500 than Nasdaq for the mere fact that the premium array at $5,773.25 - $5,902.50 has not been met yet but Nasdaq has already made it's way inside of the same SIBI imbalance. (refer to my most recent S&P500 analysis)
Aiming for low hanging fruits for now.

Where Is Market Going ? Hint Have A Hedge SmallMarkets in no mans land looking 565
Then dump break make new lows
lets see how we do tomorrow .

$ES = More downside, the bear flag and $3914 - $4376 targetsIf you look at the chart, you can see that ever since April 7th, we've been consolidating in a bear flag.
I think what's most likely here is that we break down and hit one of the targets below. The reason being, if we look at the chart since the start of the correction, we've seen 4/5 waves so far, so it would make sense that there'd be a final leg down.
Let's see if we end up hitting one of the targets. If we do, it'll mark the bottom of the correction.

Long ESSwing from last week, back at breakeven.
Entry with possible support at around $5650 (I entered early…)
SL below $5600-
TP $5800 and lets let 1 runner go to $6000 if AMD earnings goes well!

Understanding Moving Averages In TradingToday, we dive into a comprehensive guide on Moving Averages (MAs) — one of the most fundamental yet powerful tools in technical analysis. Whether you're a seasoned trader or just starting out, understanding how MAs work can help you better interpret market trends, identify potential entry and exit points, and smooth out price data for clearer decision-making.
In this article, we’ll break down the different types of moving averages, how they’re calculated, when to use them, and common strategies that incorporate them into successful trading plans.
1️⃣ 1. What are Moving Averages?
Moving averages (MAs) are statistical calculations used in technical analysis to smooth out price data and identify trends over a specific period. They help traders filter out short-term fluctuations and focus on the overall direction of an asset's price.
2️⃣ 2. Importance
Moving averages (MAs) play a crucial role in technical analysis by helping traders identify trends, reduce noise, and make informed trading decisions. Here’s why they are important:
Trend Identification: MAs help traders determine the overall direction of the market.
Dynamic Support & Resistance: Traders watch key MAs (e.g., 50-day and 200-day) to anticipate price reactions.
Trading Signals & Crossovers: Detects potential changes in trend direction.
Golden Cross (Bullish): When a short-term MA (e.g., 50-day) crosses above a long-term MA (e.g., 200-day), signaling a potential uptrend.
Death Cross (Bearish): When a short-term MA crosses below a long-term MA, indicating a possible downtrend.
Momentum Confirmation: A steeply rising MA suggests strong bullish momentum, while a declining MA signals bearish strength.
3️⃣ 3. Moving Averages Types
Simple Moving Average (SMA): Calculates the simple average of past prices.
Exponential Moving Average (EMA): Prioritizes recent prices for faster response.
Weighted Moving Average (WMA): Prioritizes recent prices for faster response.
Hull Moving Average (HMA): Smooths trends while reducing lag effectively.
Smoothed Moving Average (SMMA): Averages data with less sensitivity to noise.
Triangular Moving Average (TMA): Applies a double smoothing to price data.
Adaptive Moving Average (AMA): Adapts dynamically to changing market trends.
Kaufman Adaptive Moving Average (KAMA): Adjusts speed based on volatility and noise.
Double Exponential Moving Average (DEMA): Uses dual EMAs to reduce lag in trends.
Triple Exponential Moving Average (TEMA): Enhances trend detection with triple EMAs.
Arnaud Legoux Moving Average (ALMA): Minimizes lag while improving price smoothness.
Variable Moving Average (VMA): Adjusts its value based on market conditions.
Volume-Weighted Moving Average (VWMA): Weights price data according to trading volume
Jurik Moving Average (JMA): A highly smooth and responsive MA that reduces lag and noise.
Fractal Adaptive Moving Average (FRAMA): Adapts to market fractal geometry, adjusting speed based on volatility.
Zero Lag Exponential Moving Average (ZLAMA): A variation of EMA that eliminates lag by compensating for past price movements.
4️⃣ 4. Calculations
Moving averages are fundamental tools in technical analysis, helping to smooth price data and highlight trends. However, not all moving averages are created equal—each type is calculated differently, affecting how it responds to market movement.
In this section, we’ll focus on the formulas behind a few of the most relevant and widely used types: the Simple Moving Average (SMA), Exponential Moving Average (EMA), and Weighted Moving Average (WMA).
a. Simple Moving Average (SMA)
The Simple Moving Average (SMA) calculates the average price of an asset over a specified period.
Lag: High (delayed response to price changes)
Best for: Identifying long-term trends and support/resistance
SMA = P1 + P2... + ... + Pn / n
Where:
P1 + P2... + ... + Pn: are the prices (usually closing prices) of the last n periods.
n: is the number of periods on average.
It gives an equal weight to all prices in the period.
ta.sma(close, length)
b. Exponential Moving Average (EMA)
The Weighted Moving Average (WMA) assigns higher weights to more recent prices, reducing lag and increasing responsiveness compared to SMA.
Lag: Lower than SMA but higher than EMA
Best for: Short-term trading strategies
EMA = (Pt × α) + EMAy × (1 − α)
Where:
Pt: Current price (usually the closing price)
EMAy: Previous period’s EMA
α (alpha): Smoothing factor = 2 / (n + 1)
n: Number of periods in the EMA
It gives more weight to recent prices, reducing the lag compared to SMA.
ema = ta.ema(close, length)
c. Weighted Moving Average (WMA)
The Weighted Moving Average (WMA) assigns higher weights to more recent prices, reducing lag and increasing responsiveness compared to SMA.
Lag: Lower than SMA but higher than EMA
Best for: Short-term trading strategies
WMA = (P1 × w1 + P2 × w2 + ... + Pn × wn) / (w1 + w2 + ... + wn)
Where:
P1...Pn: Prices (usually closing) over the last n periods
w1...wn: Weights assigned to each period (most recent gets the highest weight)
n: Number of periods
It reacts faster than SMA but smoother than EMA due to its linear weighting.
wma = ta.wma(close, length)
While there are many variations of moving averages available, the formulas covered here—SMA, EMA, and WMA—represent the most essential and commonly applied in both trading platforms and manual analysis.
Understanding how these are calculated gives deeper insight into their strengths, limitations, and the types of signals they provide.
5️⃣ 5. Choosing the Right MA
Choosing the Right Moving Average for Your Trading Style
Choosing the right moving average (MA) depends on your trading style, time horizon, and goals. Different types of MAs have varying levels of sensitivity to price movements, so the choice should align with your trading strategy.
Here’s how you can choose the best moving average based on your trading approach:
Short-Term Traders (Day Traders, Scalpers)
Exponential Moving Average (EMA): The EMA reacts faster to price changes, which is crucial for short-term traders who need to enter and exit positions quickly.
Simple Moving Average (SMA): While less sensitive than the EMA, shorter-term SMAs (like the 5 or 10-period) can still be useful for spotting very quick trend changes.
Hull Moving Average (HMA): Offers a good balance between smoothness and responsiveness, reducing lag while staying sensitive to price changes.
Medium-Term Traders (Swing Traders)
Simple Moving Average (SMA): Longer SMAs (like the 50-period or 100-period) are effective in identifying the general trend over a few days or weeks.
Exponential Moving Average (EMA): The 20-period or 50-period EMA can work well for medium-term traders, providing a smoother trend signal while still responding to changes.
Smoothed Moving Average (SMMA): The SMMA gives a smoother trend and reduces the noise, which is ideal for swing traders who look for stable trends over a couple of weeks.
Long-Term Traders (Position Traders, Investors)
Simple Moving Average (SMA): Longer SMAs like the 100-period or 200-period SMA are perfect for long-term traders and investors. These averages provide a clear indication of the long-term trend and act as reliable support and resistance levels.
Triangular Moving Average (TMA): TMA smooths out price movements even more and is useful for capturing long-term trends. It's slower, but highly effective for those trading in longer time frames.
Trend-Following Traders
Exponential Moving Average (EMA): As trend-following traders rely on capturing long trends, EMAs with longer periods (50, 100, 200) are a solid choice, providing smoother signals with less noise.
Hull Moving Average (HMA): The HMA reduces lag, making it a great choice for trend-following traders who want to react quickly to changes while staying in the trend.
6️⃣ 6. How To Use Moving Averages
Moving averages (MAs) are one of the most widely used tools in technical analysis due to their simplicity and effectiveness in identifying trends, smoothing price data, and signaling potential market reversals. They are used by traders to help spot entry and exit points, determine the direction of the market, and define dynamic support and resistance levels.
Here’s a deeper dive into how moving averages are used in trading:
Identifying Trends
Uptrend: When the price is consistently above the moving average, it indicates a bullish trend. The longer the period of the moving average, the smoother it becomes, showing the overall direction of the market.
Downtrend: Conversely, when the price is consistently below the moving average, it indicates a bearish trend.
Sideways/Consolidation Market: When the price hovers around the moving average without a clear direction, the market is often in a consolidation phase.
Support and Resistance Levels
Support Levels: When the price is above a moving average and then pulls back to touch it, the moving average often acts as a support level. Traders anticipate the price to bounce off the moving average and resume its uptrend.
Resistance Levels: When the price is below a moving average and then rallies back to it, the moving average often acts as a resistance level. This resistance can lead to a reversal or consolidation as the price struggles to break above the MA.
7️⃣ 7. Golden Cross & Death Cross
One of the most well-known signals involving moving averages is the crossover of short-term and long-term moving averages. These crossovers are used to signal potential trend changes and provide traders with entry and exit signals.
Golden Cross: Occurs when a short-term moving average crosses above a long-term moving average.
Death Cross: Occurs when a short-term moving average crosses below a long-term moving average.
Golden Cross
This is considered a bullish signal, indicating that an uptrend may be starting or strengthening.
When it happens: A common example of a Golden Cross is when the 50-day moving average crosses above the 200-day moving average. The short-term trend is gaining strength and could signal the beginning of a sustained uptrend.
Why it works: The Golden Cross indicates that recent prices are moving higher and that momentum is accelerating. It suggests that buying pressure is overpowering selling pressure.
Death Cross
This is considered a bearish signal, indicating that a downtrend may be imminent or already in place.
When it happens: A typical example of a Death Cross is when the 50-day moving average crosses below the 200-day moving average, signaling that the short-term trend is weakening and a bearish shift may be in play.
Why it works: The Death Cross shows that short-term price movements are declining relative to longer-term trends, and it indicates increasing selling pressure.
8️⃣ 8. MA Strategies
Trend Following
The trend following strategy focuses on identifying and capitalizing on strong price movements in one direction.
Trend Identification: Moving averages are used to identify whether the market is trending up or down. The most common trend-following strategy is to buy when the price is above a key moving average and sell when it’s below.
Trend Confirmation: Once the trend is identified using MAs, traders can enter trades that align with the trend. The idea is to "ride the wave" of the trend as long as possible until there is evidence of a reversal or loss of momentum.
MA Crossover
Moving average crossovers are one of the most popular and widely used strategies in technical analysis. Crossovers occur when a short-term moving average crosses over a longer-term moving average, signaling potential trend changes.
Short-Term Crossovers: These are typically faster and more sensitive, which can help traders spot quicker market changes. Short-term crossovers tend to generate more signals, but they can also lead to more false signals in choppy or sideways markets. (9 EMA & 21 EMA Strategy)
Long-Term Crossovers: These are slower and less frequent but tend to produce more reliable trend signals. Long-term crossovers filter out market noise and provide a clearer view of the overall market direction. (The 50/200-Day Moving Average Strategy)
Mean Reversion
Mean reversion is based on the idea that prices tend to return to their average over time.
How to Identify Overextended Prices
Overbought and Oversold Conditions: When the price is significantly above or below a moving average, it may be overextended. In such cases, traders expect the price to revert to the moving average.
Using MAs as a Benchmark: Traders can use longer-term MAs, like the 50-day or 200-day moving averages, to identify overextended conditions. If the price moves significantly above or below the moving average, it is often seen as an opportunity for mean reversion trades.
Trading Moving Average Pullbacks
Pullbacks: A pullback is when the price moves against the prevailing trend, temporarily retracing toward the moving average before resuming its original trend.
Buying Pullbacks in Uptrends: In an uptrend, traders look to buy when the price pulls back to a moving average like the 50-day or 200-day MA, assuming the trend will continue.
Selling Pullbacks in Downtrends: In a downtrend, traders look for selling opportunities when the price temporarily rallies back to a moving average, anticipating a return to the downtrend.
9️⃣ 9. Key Takeaways
Moving Averages (MAs) smooth price data, helping identify trends, entry, and exit points.
Trend Following Strategies use MAs to align trades with the market’s direction (uptrend, downtrend).
Support & Resistance: MAs act as dynamic levels where prices may reverse or consolidate.
Crossovers:
- Golden Cross (50/200-day crossover) signals a bullish trend.
- Death Cross (50/200-day crossover) signals a bearish trend.
- Short-Term Crossovers (9/21 EMA) provide faster signals for active traders.
Mean Reversion Strategy: Prices often revert to their moving average after being overextended.
Pullback Trading: Enter trades when prices pull back to key MAs during trends.
Combining Indicators:
- RSI confirms MAs’ buy or sell signals.
- MACD crossover strengthens trend direction confirmation.
- Bollinger Bands help assess volatility, confirming price targets and trends.
Timeframe Selection: Short-term traders use quicker MAs (e.g., 9 EMA), while long-term traders prefer slower MAs (e.g., 200-day SMA).
Best MA Settings: For trend-following, use 50/200-day MAs; for short-term, use 9/21 EMAs.
Stay sharp, stay ahead, and let’s make those moves. Until next time, happy trading!

AMP Futures - % (LTP) Calculation for Renko, Kagi, and PnF chartIn this idea we will demonstrate how to apply LTP calculation for Renko, Kagi, and Point & Figure chart types.

ES Premarket UpdateBad numbers across the board, ES got the gap fill yesterday, now MFI is overbought. Expect it to go down until RSI hits oversold, maybe (maybe) bounce, then go for the gap fill below.

Weekly Market Forecast: Buy Stocks! Sell Oil! Buy Gold!In this video, we will analyze the S&P 500, NASDAQ, DOW JONES, Oil, Gold and Silver futures, for the week of April 28 - May 2nd.
Markets are looking tradeable again.
The indices look bullish, creating +FVGs as they move higher.
Oil has corrected a bearish impulse, so it could be poised to move lower from the Daily and Weekly -FVG.
Gold took a breather last week and could move higher from the Weekly +FVG it just created.
Let's go!
Enjoy!
May profits be upon you.
Leave any questions or comments in the comment section.
I appreciate any feedback from my viewers!
Like and/or subscribe if you want more accurate analysis.
Thank you so much!
Disclaimer:
I do not provide personal investment advice and I am not a qualified licensed investment advisor.
All information found here, including any ideas, opinions, views, predictions, forecasts, commentaries, suggestions, expressed or implied herein, are for informational, entertainment or educational purposes only and should not be construed as personal investment advice. While the information provided is believed to be accurate, it may include errors or inaccuracies.
I will not and cannot be held liable for any actions you take as a result of anything you read here.
Conduct your own due diligence, or consult a licensed financial advisor or broker before making any and all investment decisions. Any investments, trades, speculations, or decisions made on the basis of any information found on this channel, expressed or implied herein, are committed at your own risk, financial or otherwise.

The Candles Are Bullish… BUT Is a Reversal on the Horizon?Back on April 28th, we talked about the ES potentially pushing higher — and guess what? It did exactly that! 🎯
Now we find ourselves at a key crossroads.
A new month is here, and with the previous monthly candle officially closed, there’s a strong case to be made for even higher prices — possibly up to the 5776 level. 📈 That said, I’ll be diving into the analysis today where I’ll also touch on some reasons why short-term selling could still show up.
To be fair, the price action from April (1st–30th) hasn’t given us a lot of evidence for a major reversal, but as always, it’s our job as analysts to stay sharp and open to all possibilities — especially in today’s climate.
Right now, I’m still on board the bullish train 🚂 and the charts continue to suggest upward momentum. But I’ll be watching closely for any shifts that might hint at a change.
What about you? What’s your take on the current setup? Let’s get the conversation going — I’d love to hear your thoughts!
Let's Keep Studying - One Candlestick At A Time!

The bias is for move to the upsideThe bias for the S&P 500 daily chart is for move to the upside but if we do get that follow-through I'm not looking for a dramatic move as the market gets ready to hear what the Fed has to say on Wednesday.


Retracement Lower Before Continuing HigherThis week could be another bullish week.
The move down yesterday could be our manipulation to continue higher later this week. As we had a sweep on a daily level, I will be looking for retracement lower (today) before finishing the week higher.

S&P 500 – iSpark Catches Clean Breakout from 5330 to 5700📢 The iSpark Indicator caught a strong breakout on the S&P 500 Index (4H chart) around the 5330 level , which was followed by a sequence of bullish moves — now reaching the 5700 mark.
🔍 Currently, price is testing the 10 EMA at 5710 , which is acting as a short-term resistance . A clear break and sustained move above 5710 could trigger the next leg higher toward 5750–5775 .
🎯 Holding positions? Stay in with a stop-loss at 5600 to manage risk.
📉 Fundamental caution: As always, keep an eye on macro headlines — unexpected global turmoil or sharp trade commentary (e.g., tariffs) may influence momentum
💡 This entire setup was captured early using the iSpark Indicator , designed to detect high-conviction breakouts across timeframes.
📬 Premium users interested in testing the iSpark Indicator can DM me for a hands-on walkthrough.
#SP500 #ES1! #Breakout #iSpark #TechnicalAnalysis #TradingStrategy #EMA #TrendFollowing #SPX #TradingView #SNP500
Tariffs, and Tumult: Wall Street Waits on Super WednesdayHello everyone, it’s April 30, 2025. The TVC:DJI just closed its sixth consecutive green session, with markets clinging to hope as rumors swirl of a first tariff deal—possibly with India—though nothing is confirmed. That tiny breadcrumb of optimism was enough to boost sentiment late in yesterday’s session, even if volatility is dipping below 25% and investor enthusiasm seems to be fading in lockstep.
U.S. macro data continues to paint a picture of “not great, but not terrible.” Consumer confidence and job openings (JOLTS) came in below expectations but not disastrously so, prompting markets to collectively shrug and declare everything “less worse than feared.” It’s a strategy now: ignore bad data as long as it isn’t apocalyptic.
As earnings roll in, companies are split between those who pretend the tariff storm is “manageable” (hello, NASDAQ:COKE ) and those flying blind through economic fog ( NYSE:UPS , Snap, and Super Micro—who might be losing a major client named Nvidia). The overall takeaway? Visibility is garbage, and most companies are bracing rather than building.
All eyes are now on today’s so-called Super Wednesday, packed with economic data (U.S. GDP, PCE, ADP jobs, Chicago PMI) and mega-earnings from NASDAQ:MSFT and NASDAQ:META . But as usual, expectations may outpace reality. Markets often dream of clarity and wake up to more noise.
Meanwhile, China flashed its first big red light: a manufacturing PMI of 49, signaling contraction—the lowest in two years. No shock, considering their ongoing trade war with the U.S., which seems to be giving the global economy the flu.
On the political front, Trump celebrated his 100 days in office with a campaign-style detour to Detroit, throwing shade at Fed Chair Jerome Powell while declaring the economy in perfect health (despite the worst market performance since Nixon’s early days). He promised tax cuts, again, while doubling down on trade threats. Powell, of course, is just trying to survive the week.
Oil briefly dipped under $60 as markets considered the broader implications of economic warfare, gold sits at $3,311, and Bitcoin hovers around $95,000—looking resilient despite the madness.
As for corporate earnings, Starbucks missed on sales due to weak U.S. demand, Pfizer beat on EPS but saw revenue fall, and Visa continues to rake in profits as Americans keep spending like inflation isn’t real. Novartis crushed it but got no love from the market because apparently, +22% net income just isn’t sexy enough.
In short: chaos remains king. Markets seem oddly calm on the surface, but under the hood, it’s still all about tariffs, Trump tweets, and the fantasy that maybe—just maybe—some clarity will come today. Don’t hold your breath.
Enjoy the ride, and see you tomorrow for more market mayhem.
