Long ESSwing from last week, back at breakeven.
Entry with possible support at around $5650 (I entered early…)
SL below $5600-
TP $5800 and lets let 1 runner go to $6000 if AMD earnings goes well!
ES1! trade ideas

Tariffs, and Tumult: Wall Street Waits on Super WednesdayHello everyone, it’s April 30, 2025. The TVC:DJI just closed its sixth consecutive green session, with markets clinging to hope as rumors swirl of a first tariff deal—possibly with India—though nothing is confirmed. That tiny breadcrumb of optimism was enough to boost sentiment late in yesterday’s session, even if volatility is dipping below 25% and investor enthusiasm seems to be fading in lockstep.
U.S. macro data continues to paint a picture of “not great, but not terrible.” Consumer confidence and job openings (JOLTS) came in below expectations but not disastrously so, prompting markets to collectively shrug and declare everything “less worse than feared.” It’s a strategy now: ignore bad data as long as it isn’t apocalyptic.
As earnings roll in, companies are split between those who pretend the tariff storm is “manageable” (hello, NASDAQ:COKE ) and those flying blind through economic fog ( NYSE:UPS , Snap, and Super Micro—who might be losing a major client named Nvidia). The overall takeaway? Visibility is garbage, and most companies are bracing rather than building.
All eyes are now on today’s so-called Super Wednesday, packed with economic data (U.S. GDP, PCE, ADP jobs, Chicago PMI) and mega-earnings from NASDAQ:MSFT and NASDAQ:META . But as usual, expectations may outpace reality. Markets often dream of clarity and wake up to more noise.
Meanwhile, China flashed its first big red light: a manufacturing PMI of 49, signaling contraction—the lowest in two years. No shock, considering their ongoing trade war with the U.S., which seems to be giving the global economy the flu.
On the political front, Trump celebrated his 100 days in office with a campaign-style detour to Detroit, throwing shade at Fed Chair Jerome Powell while declaring the economy in perfect health (despite the worst market performance since Nixon’s early days). He promised tax cuts, again, while doubling down on trade threats. Powell, of course, is just trying to survive the week.
Oil briefly dipped under $60 as markets considered the broader implications of economic warfare, gold sits at $3,311, and Bitcoin hovers around $95,000—looking resilient despite the madness.
As for corporate earnings, Starbucks missed on sales due to weak U.S. demand, Pfizer beat on EPS but saw revenue fall, and Visa continues to rake in profits as Americans keep spending like inflation isn’t real. Novartis crushed it but got no love from the market because apparently, +22% net income just isn’t sexy enough.
In short: chaos remains king. Markets seem oddly calm on the surface, but under the hood, it’s still all about tariffs, Trump tweets, and the fantasy that maybe—just maybe—some clarity will come today. Don’t hold your breath.
Enjoy the ride, and see you tomorrow for more market mayhem.

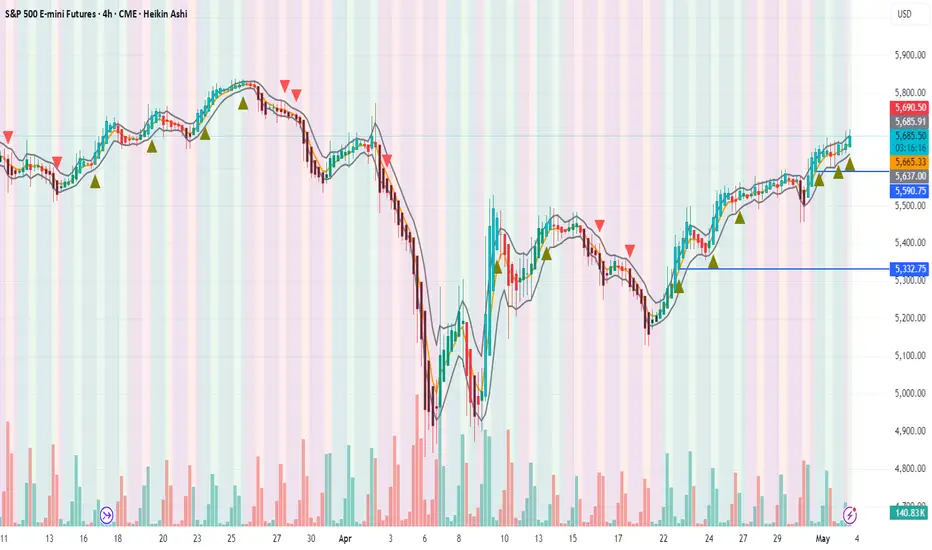
S&P 500 – iSpark Catches Clean Breakout from 5330 to 5700📢 The iSpark Indicator caught a strong breakout on the S&P 500 Index (4H chart) around the 5330 level , which was followed by a sequence of bullish moves — now reaching the 5700 mark.
🔍 Currently, price is testing the 10 EMA at 5710 , which is acting as a short-term resistance . A clear break and sustained move above 5710 could trigger the next leg higher toward 5750–5775 .
🎯 Holding positions? Stay in with a stop-loss at 5600 to manage risk.
📉 Fundamental caution: As always, keep an eye on macro headlines — unexpected global turmoil or sharp trade commentary (e.g., tariffs) may influence momentum
💡 This entire setup was captured early using the iSpark Indicator , designed to detect high-conviction breakouts across timeframes.
📬 Premium users interested in testing the iSpark Indicator can DM me for a hands-on walkthrough.
#SP500 #ES1! #Breakout #iSpark #TechnicalAnalysis #TradingStrategy #EMA #TrendFollowing #SPX #TradingView #SNP500

Earnings this week pushes Spy upSpy will see more upside this week with Meta earnings tomorrow after market close. Google was already a good tone setter of this week.

The Candles Are Bullish… BUT Is a Reversal on the Horizon?Back on April 28th, we talked about the ES potentially pushing higher — and guess what? It did exactly that! 🎯
Now we find ourselves at a key crossroads.
A new month is here, and with the previous monthly candle officially closed, there’s a strong case to be made for even higher prices — possibly up to the 5776 level. 📈 That said, I’ll be diving into the analysis today where I’ll also touch on some reasons why short-term selling could still show up.
To be fair, the price action from April (1st–30th) hasn’t given us a lot of evidence for a major reversal, but as always, it’s our job as analysts to stay sharp and open to all possibilities — especially in today’s climate.
Right now, I’m still on board the bullish train 🚂 and the charts continue to suggest upward momentum. But I’ll be watching closely for any shifts that might hint at a change.
What about you? What’s your take on the current setup? Let’s get the conversation going — I’d love to hear your thoughts!
Let's Keep Studying - One Candlestick At A Time!

The bias is for move to the upsideThe bias for the S&P 500 daily chart is for move to the upside but if we do get that follow-through I'm not looking for a dramatic move as the market gets ready to hear what the Fed has to say on Wednesday.

A confident close but...A confident close in the S&P 500 daily chart on Friday was an indicator that buyers are willing to hold positions through the weekend. But the next challenge will be to carry through of this momentum on Monday starting with the Asia session Sunday night 5 o'clock Chicago time. The upside objective for Monday would be 5750.

Why I Hesitate on Long Wick Candles (and How I Trade Through It)In today’s live trading review, I highlight one of the key challenges I face when trading the ES:
I don’t always feel confident executing during long wick days.
So how do I deal with that? Simple: reduce risk and stick to the framework.
Watch as I walk you through this session, break down the setup, and share how you can identify and study your own trading weaknesses — so you can grow stronger, one trade at a time.
#OneCandlestickAtATime #LiveTrading #ESFutures #TradingPsychology

SP 500 - Look Out Below!Downward possibilities for SP can be breathtaking. 1000 point drop possible. Cheap puts can score big.
Perhaps Friday's job report will be the trigger??

S&P500: Rebound or Bull Trap?Over the past week, the S&P500 weekly chart showed a key technical signal: the formation of a bullish engulfing.
This pattern emerged after several weeks of strong monthly bearish pressure, suggesting a potential reversal attempt or, at the very least, a technical rebound.
Analyzing the key levels, the price reacted inside a major demand area (visible on the monthly timeframe), positioned between 5,450 and 5,500 points.
The reaction from this zone reinforces the validity of the engulfing and suggests the market could now aim for the first resistance targets around 5,600 - 5,650.
Further upside targets are located at 5,837 and 6,023, previously marked as high-confluence zones.
From an institutional positioning perspective, the latest COT Report (April 22, 2025) reveals interesting developments:
Commercials (big players) increased their long contracts by +22,226 units, showing strong interest in upside protection.
Non-Commercials (speculators) also increased their longs (+8,754), but added even more to their shorts (+20,667).
The Net Positioning for Non-Commercials remains negative but has stabilized at less extreme levels compared to March, suggesting a possible phase of accumulation or preparation for a sentiment shift.
📊 The Net Positions chart shows a reduction in net short pressure — a warning sign for those still heavily short.
Summary:
The weekly engulfing is a technical signal not to underestimate.
We are trading within a strong monthly demand zone.
COT data suggests a decrease in bearish pressure, although not yet a full sentiment reversal.
However, caution is necessary: a firm break below 5,450 would invalidate the bullish signal and reopen the path toward corrections at 5,200 and 5,000.
Current Strategy:
Slight bullish bias above 5,500.
Short-term target: 5,600 → 5,650.
Next targets: 5,837 and 6,023.
Invalidation level: weekly close below 5,450.
Watching the price action around key resistance levels will be crucial: the market will decide whether this rebound consolidates or becomes just a trap for new buyers.

ANALISI TECNICA MERCATI AMERICANIHappy Saturday to all traders! In this video we analyze the American market and see what we can expect in the coming weeks.
Recently, the markets have reacted positively to the statements of President Trump, who made it clear that he has no intention of removing Jerome Powell from the leadership of the Federal Reserve. This reassurance helped to allay concerns about the independence of the Fed, leading to a rally in the main indices: the Nasdaq gained 2.3%, the S&P 500 1.4% and the Dow Jones 1%. In addition, the administration has shown signs of openness towards reducing trade tariffs with China, fueling investor optimism. Despite the recent reassurances, uncertainties related to the Fed's monetary policy remain. Powell stressed that, although inflation is falling, there is no rush to proceed with further rate cuts, maintaining a cautious approach. Investors will therefore need to carefully monitor the upcoming macroeconomic data, especially those related to inflation and employment, which could influence the Fed's future decisions.
Next week promises to be decisive for the US stock markets. Although the recent statements by Trump and Powell have helped improve investor sentiment, the presence of technical resistance and uncertainty about the Fed's future policies suggest caution. An upward break of key levels could confirm the continuation of the positive trend, while signs of weakness could indicate the need for a consolidation phase.
Have a good weekend everyone and happy trading.
Thanks Ciao Mauro
I will mention my three rules that I constantly cultivate:
Patience, discipline and always have a plan.

S&P futures ES1! .. or SPY parallel channels for this weekNot much to explain here...since so many these days can't last through even a half a paragraph....but, the two lines capture a decent amount of stuff and show the most recent action of today with the ping-pong whipsaw.
Does it hit the question mark or stay in the lower parallel...it all depends on how Amazon and Apple can 'Tim cook-their books' and show the world that raging credit defaults and stagnating US with tensions going to hell around the globe doesn't matter.
Would guess from Wed-Thursday that:
Microsoft dips early and then trends sideways before a slight tilt down....
Meta just rips cause I have no idea how they achieve anything except cooking so...
Qualcomm makes up a guidance that show modest 2nd half recovery after "The current tariff uncertainty is stabilized and the need for technology advancement outshines global tensions" or something to that affect.
Amazon and Apple are a repeat of what I said before....Amazon will say they had strong buying heading into the tariffs but they see a slight pull back in consumer willingness to spend. Their cloud-whatever will somehow deliver them through the earnings call with some like 2.37% beat or some crap- but they will probably use 3 words that some algo doesn't want to hear and their stock will initially pop and then retrace the pop and pullback the equivalent move but to the downside. And lastly, Apple....don't care for them and will just say this- "We see strong foreign demand for the iPhone abroad with a high interest from India now that manufacturing will be shifted to that market(minus the fact it is only for the US market...all foreign production will be in China still and the "made in India" will be a quasi fulfillment slight of hand). While we are wading through the uncertainty of China-US relations in regard to tariffs- we see a sustained interest in iPhone sales with an increase in Apple cloud/whatever they call it- services maybe- from foreigners". So.......Apple goes initially down on some like margin metric being a miss or like revenue being like .8% off...but then Cook squeaks a fat steamer on the intercom which allows for the short reversal to the upside, which will kinda die out by next Monday.
Or.....All the above get slammed and the puts go into the weekend happy. Check OptionCharts.io for the open interest for the 30th and may 1st...decent action on the put positions already hitting almost 3/4 million...also just be understanding that Wednesday may be window dressing day for monthly hedge fund/brokerage portfolio allocations...So if there are bad earnings they may dump stock to let their people know they aren't exposed as heavy...but if good earnings you may get a ripping short squeeze from them trying to load up their customers with the big 7...so be careful out there...
Play with the money you have...and not with the money you can't afford to lose....for margins make marginal gains and massive losses when things go wrong- just see the Japanese Pensions unloading treasuries...some benefit...many lose... :)
5 min view:
Addition of one more parallel on the 30 min:
and a 5 min view of the one above on this week's lines:

Bullish Price Delivery on MESIn this week's analysis of the ES futures contract, it still looks reasonable to expect bullish price action.
Given the price delivery over the past few weeks, it appears that large institutions are continuing to push the market higher — a strong signal to maintain a bullish bias!
Key levels I'm watching:
Bullish target: 5,590 (with potential for even higher moves)
Support zones:
First support around 5,497
Stronger support around 5,447 in a worst-case scenario
While it's important to recognize that we may be approaching a "high" within the larger downtrend, from a short-term perspective (this week), I expect these support levels to hold and for bullish momentum to continue.
Of course, as with all speculation, we’ll monitor closely and react accordingly — always studying price action one candlestick at a time!

S&P 500 E-mini Futures: Bullish Momentum Meets Key Resistance📈 Technical Analysis: S&P 500 E-mini Futures (ES1!) – April 2025
🚀 Market Structure & Price Action for US500
The daily chart shows the S&P 500 E-mini Futures in a bullish recovery after a significant correction. The recent rally has pushed price back toward previous swing highs, an area likely to contain resting buy-side liquidity. This move suggests that the market is currently in a markup phase, but is now approaching a critical resistance zone where profit-taking and counter-trend activity may emerge.
🧠 Wyckoff Perspective
From a Wyckoff methodology standpoint, the recent price action resembles a classic accumulation-to-markup transition. The sharp selloff in March and early April appears to have formed a selling climax (SC) followed by an automatic rally (AR) and a secondary test (ST). The current advance could be interpreted as a sign of strength (SOS), but the proximity to previous highs raises the risk of an upthrust (UTAD) or a bull trap if supply emerges.
🌊 Liquidity & Potential Pullback
As price trades into the prior highs, it is likely "eating" buy-side liquidity—triggering stops and breakout orders. This process often leads to a liquidity sweep, where price briefly exceeds resistance before reversing as large players offload positions. If the market fails to sustain above these highs, a pullback or even a reversal could be initiated, especially if volume and momentum wane.
🌐 Market Sentiment & Fundamentals
Current sentiment remains cautiously optimistic, with the S&P 500 E-mini trading above 5,500 and recent sessions showing resilience despite mixed earnings and macroeconomic uncertainty. The broader market is supported by expectations of stable Fed policy and robust corporate earnings, but there are persistent concerns about inflation and global growth. According to Markets Insider, the ES futures are up 0.59% recently, reflecting a positive but not euphoric tone. However, as noted by Investing.com, there are signs the market could be setting up for a reversal if bulls fail to maintain momentum.
🛠️ Trade Ideas
🟢 Bullish Scenario: If price breaks and holds above the previous highs with strong volume and closes, consider a long entry targeting the next psychological resistance (e.g., 5,700–5,800). Place stops just below the breakout level to manage risk. This would confirm continued demand and a potential extension of the markup phase.
🔴 Bearish Scenario: If price fails to hold above the highs and forms a reversal pattern (e.g., bearish engulfing, upthrust), look for a short entry targeting the first support zone (e.g., 5,300–5,200). Stops should be placed above the failed breakout. This would align with a Wyckoff upthrust after distribution and a likely liquidity sweep.
⚠️ Disclaimer
This analysis is for informational purposes only and does not constitute financial advice. Trading futures involves significant risk and may not be suitable for all investors. Please conduct your own research and consult with a licensed financial advisor before making any trading decisions.

AMP Futures - Boost your analysis with TPO summary info.In this idea we will demonstrate how to add the new Summary info table for TPO charts using Tradingview.

ES Futures-ICT Concepts (Levels for 4/28-5/2)Levels to observe for next week April 28 through May 2, 2025
Based on ICT concepts, There has been a change in the states of delivery (CISD) and Fair value gap (FVG) that has formed on the daily time frame.
This, of course, is after price has delivered lower into a discount area.
Looking for by programs on Monday and Tuesday, given that it’s is NFP protocol.

MES!/ES1! Day Trade Plan for 04/25/2025MES!/ES1! Day Trade Plan for 04/25/2025
📈 5530 5560
📉 5475 5445
Thanks to all my followers! Truly appreciate the support!
Please like and share for more NQ levels Tues & Thurs 🤓📈📉🎯💰
*These levels are derived from comprehensive backtesting and research and a quantitative system demonstrating high accuracy. This statistical foundation suggests that price movements are likely to exceed initial estimates.*

S&P 500 - Low Resistance Liquidity Run To $5,600?Over 10 days has been spent trading inside of Wednesday 9th April 2025 daily candle with Friday 25th being the day that we witnessed expansion through buyside liquidity.
I would like to see a continuation further inside of the weekly SIBI of $5,649.75 - $5,532 C.E.
Low hanging fruits going into next week guys!

ES/SPY Market Prediction April - July 2025ES/SPY Bounced of the Previous 2022-23 highs
Looking for retracement to gap fill to downside
before continuing the move up.
This prediction is to play out in next 3-4 months
Prediction is assuming levels marked will hold/reject.
Disclaimer: This prediction is my opinion and not
intended to be taken as financial advice.

A market setting up.Monday in the S&P 500 daily chart indicates that buyers bought the break in this market setting up a bullish bias in a week that is filled with economic and equity reports which create a tremendous amount of uncertainty.

SP500 Weekly Action Areas & Price Targets 28/04/25In this update we review the recent price action in the emini SP500 futures and identify high-probability action areas and price objectives for the trading week ahead. To review today's video analysis click here!

Weekly Chart Shows Buyers Holding, But Resistance TightensMarket Overview:
Futures are hovering at a crucial zone. In this update, we analyze the evolving trend structure, dissect price action at Fib resistance, and highlight what levels matter most heading into the next session.
Bearish/Bullish Trend Analysis
Trend Condition:
Bullish Trends: 8
Bearish Trends: 6
Overview: The market is currently bullish, with 8 trend lines signaling upward momentum. However, the presence of 6 bearish trends shows that mixed conditions remain across different timeframes.
Price Action and Momentum Zones
Current Price and Change:
Currently, the S&P 500 Futures are at 5,520.25, down by 32.25 points or -0.58%.
Market Behavior:
The weekly chart shows consolidation just below major resistance, with sellers maintaining pressure near the 23.6% retracement zone. Price action remains choppy after several weeks of volatility.
Momentum Zones:
Price is stuck within a corrective zone between the 23.6% and 38.2% retracement levels. In this context, these zones act as countertrend resistance, and bulls need a clean breakout above 5,537 to shift sentiment more decisively.
Fib Retracement Levels
Current Position Relative to Levels:
The market is currently just below the 23.6% retracement level.
Key Fibonacci Levels:
23.6% → 5,537.68
38.2% → 5,148.66
50.0% → 4,834.25
61.8% → 4,519.84
Analysis:
A clear breakout above 5,537.68 would indicate a more meaningful recovery attempt. Failure here could send price back toward the 5,148 or 4,834 retracement levels if momentum fades.
Overall Market Interpretation
While the broader trend is still bullish on this timeframe, the failure to reclaim 5,537 suggests caution. Consolidation below major Fib levels implies that buyers are struggling to regain control. A breakout or breakdown from this range will set the next directional tone.
Summary
The S&P 500 Futures are showing mixed strength early in the week. The broader trend remains bullish overall, but the 23.6% Fibonacci retracement level is acting as resistance. This level will likely determine whether consolidation continues or a stronger move higher begins.
