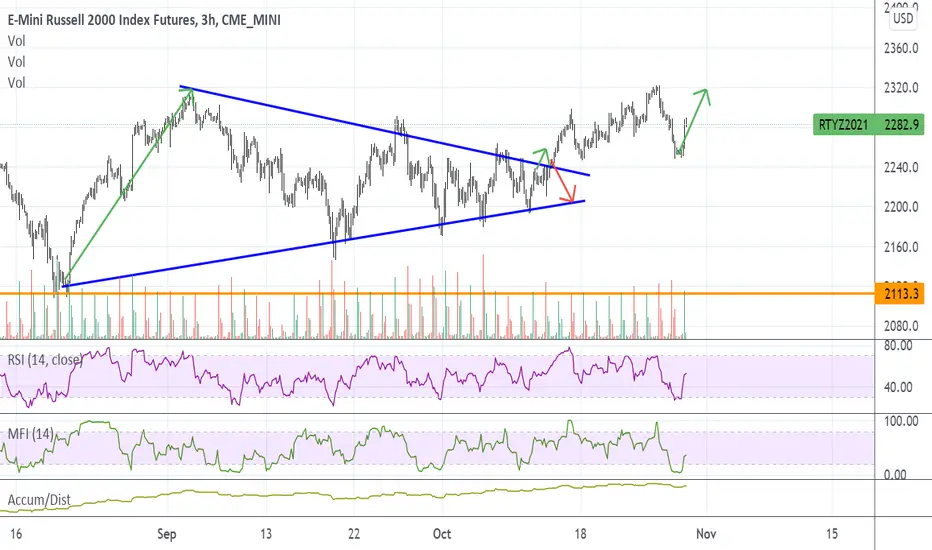
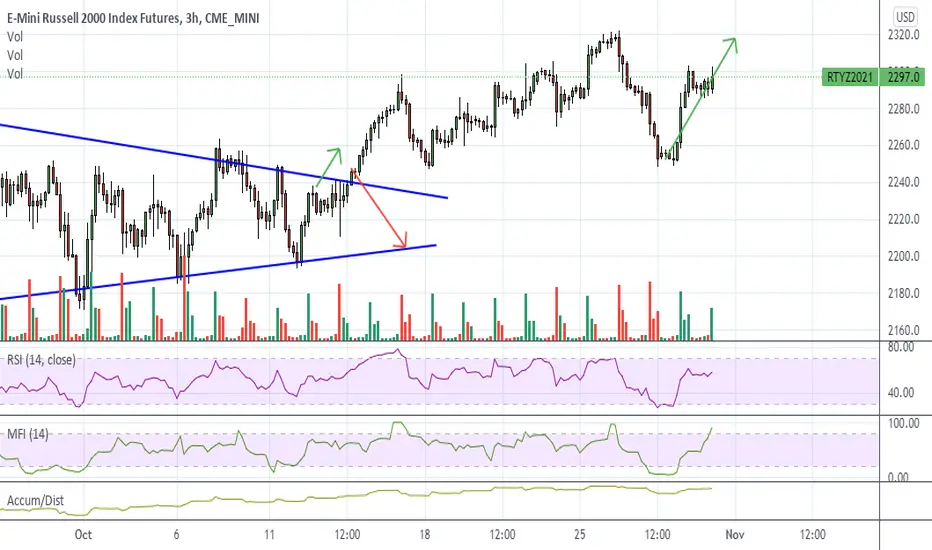
iwm updatepreviously i discussed the requirement for iwm to break-out of the range it was in \ consolidate above it & hold to see continued upside for that final fifth wave.
we've broke out finally, but is this a real breakout, or is it just another trap?
i'd like to see it consolidate up here for at least another week before making any kind of decision.
if it could pull this off, we'll see small caps go parabolic for a bit.
----
20 year count 👇
M2K1! trade ideas

Hustle in the RussellAnother straight forward idea, RTY came back into a very nice retracement area with the down sloping trend line and horizontal support from the September high. This is a great area to add for a bounce and a stop would be a daily close below today's low. The target is around the 2380 area, and if all goes well it should tag it before the end of the year.

Russel long move like last fridays DOW movetoday the russel 2000 index provided a nice entry spot at prior monthly swing high to go long
targeting the resistance zone above 2350...

RTY LonnngggRTY .618 tap on the fib retracement. I'm long here as a result. Good r/r after making ath.

Russell2000 Correction CompletingIN this update we review the current corrective cycle in the Russell and identify the next high probability trading opportunity

Buying small capI am buying Russell 2000 on current support. I think that there is great relative value in small cap US stocks, and this looks like it will turn out great.

RTY1! PossibleThis is an idea based on technical analysis, RTY1! is an assest i have not traded before so just technical skill analysis based on range breakout on the 4hrs chart. still do well to take it down to your smaller timeframes.

Russel 2000 Continuation TradeIn this update we review the price action in the Russell break out trade and identify the next high probability trading opportunity

RTY - possible tradeIt's a choppy friday.. Russell is holding up well.. looking for a break below to sort.. May decide not to take trade this late of Friday...


RTY1!11.9.21 Russell 2000 Looking at the subtle and not-so-subtle clues of a raging market expanding higher. Bobby's Homework Assignment.


Russell 2000 Futures Headed To 2668?Exactly one year ago this month the Russell 2000 broke out to new highs and many were calling it the November to Remember as the RTY had an all-time record 18.4% monthly total return This November the Russell 2000 is also breaking out to new highs and on my strategy the look is exactly the same as last year. Will this be another November to remember? I think so, but I don't think it will be an 18.4% rally like last year. I do think that the RTY could rally 10% and look to test 2668 before the end of the year. I use Bollinger Bands with 20 period, 3 standard deviation settings along with a simple 10 period simple moving average on a weekly, daily and 60 min charts as my strategy for this long swing trade.

RTY UpdateThis is what I mean by pump and dump, look at the sell volume in the morning.
The algos have managed to convert futures trading into a pump and dump scheme and teh dip buyers are letting them make their money, lol. Small caps still flat despite the dump. Sideways action until the dip buyers are gone.
Watch MFI though, as soon as it goes oversold we'll see another pump

RUSELL 2000 Close to break 10-Month LateralHi,
You can wait for it to confirm the lateral breakout and retest the broken level.
If the RUSSELL 2000 breaks this 10-Month lateral movement from my POV is the best signal that we are still in a bull run, and at least we've a 10% upside potential.
Luck!

Multiple Chart TypesConsider using multiple chart types when performing technical analysis for a clearer picture of what the market may be telling you. Here is a tri-screen view of Traditional Japanese Candles on top, Renko Candles in the middle, and Heiken-Ashi Candles on the bottom. Each setup has something to share.

My best bet in going in selling No to much to talk about indices but I really thing it's a slumping after huge upside.

RTY1! (Russel 2000 fakeout or breakout) ? - Fakeout so far.(Opinion only)
Just a chart, think for yourself. :)

RTY longLong RTY
After consolidating of roughly 185 days, it looks like the RTY is ready for a nice break out
First target 3463 zone
Second target 2600 zone
Invalidation day close below 2284

Russell 2000 measured move after the breakoutRTY/IWM looking for a measured move after a long consolidation. I'm thinking it will retest the high of 2366 before the run.

RTY UpdateMFI went overbought as expected, but RSI didn't because of the indirect effect from AAPL and AMZN miss.
Could go either way Monday
Russell2000 Trading Wave 5 In this update we review the set up for a wave 5 extension in the Russell

RTY UpdateLooks to me like it wants to go overbought again. I told you guys yesterday it was oversold.
Small caps probably rally tomorrow since it's Ponzi Friday, ES and NQ direction will depend on AAPL and AMZN earnings, but I'm stating teh obvious.