NQ Short (05-09-25)KL 20,341 is the level to stay Short under. The tricks in the O/N and 10 minute pop 300 point Tweets are loosing effect. Fed Day was strange and UK Deal was overrated. Existing longs may pick up some speed on stalling lifts. Yellow arrows to the left are short targets.
MNQZ2023 trade ideas

GAP-UP-DUMP-DOWN Shakeout!Gap-up-dump-down shakeout could be on here as as a start of week shakeout.
And this would appear as a gap on the week chart.
This potentially could be the start of the high frame top down and down into a major crash.
But long way to go.
I am short here
Not advice

NQ Short (05-05-25)April 21 Post is at upper Target, looking for drop here after the most likely Monday lift to stall out. NAZ is still inside the Insignificant Range of Noise.
4/21/25 Chart

NQ Analysis - 11th May 2025Here is my analysis of NQ, a pair I do not trade and only very seldomly do analysis for.
I've been wanting to get into indices futures, so I will be doing more analysis on them in the future. I still have to learn about the contract sizes, average moves, etc.
- R2F Trading

S&P / Nasdaq - Crash Of The CenturyMight not quite be a crash to rival the dot com / subprime crashes, but might be quite a big one here.
And you never know, perhaps it might just be the crash of the century.
Here's my TA for this area - the details are everything.
Enjoy 👍.
Not advice.

Nasdaq 100: Bulls in Control for Now, but Key Hurdles RemainNasdaq 100 futures have gapped higher upon the Asia market open, leaving them sitting above the important 200-day moving average. With momentum indicators like RSI (14) and MACD generating bullish signals, it’s an environment that favours buying dips and topside breaks.
However, the coast is not entirely clear for bulls with the price struggling to take out the March 28 high of 20,536. The January 2023 uptrend is also nearby, sitting just above 20,600. Zooming out, the price has also been coiling in a rising wedge pattern, warning there may be an eventual resumption of the bearish trend seen between late February and early April.
While some bulls may be willing to buy above the 200-day moving average with a stop beneath for protection, others may prefer to wait for a decisive push above the top of the resistance zone around 20,650 before establishing positions. Topside levels to keep on the radar include 21,000, 21,420 and 21,969.
If the price were to reverse back below the 200-day moving average and close there, it would swing near-term directional risks lower, invalidating the bullish bias.
Good luck!
DS


NQ1 - Out Of Hours Pop = Exhaustion Gap?NQ1
Very sudden pop happening out of hours.
Impulsive action outside of regular trading hours can often be dangerous.
There is a reasonable chance that this move is the final blow off phase of the uptrend to set up an exhaustion gap in regular trading hour indices before the next wave down.
FOMC tomorrow might provide the volatility to print a topping candle.
We'll see - obviously that just one possible outcome.
But if it gaps up tomorrow I'm going to be thinking of short opportunity🤨.

NASDAQ - continue with the UptrendOn NASDAQ , it's nice to see a strong buying reaction at the price of 20150.
There's a significant accumulation of contracts in this area, indicating strong buyer interest. I believe that buyers who entered at this level will defend their long positions. If the price returns to this area, strong buyers will likely push the market up again.
(FVG) - Fair Value GAP and high volume cluster are the main reasons for my decision to go long on this trade.
Happy trading
Dale

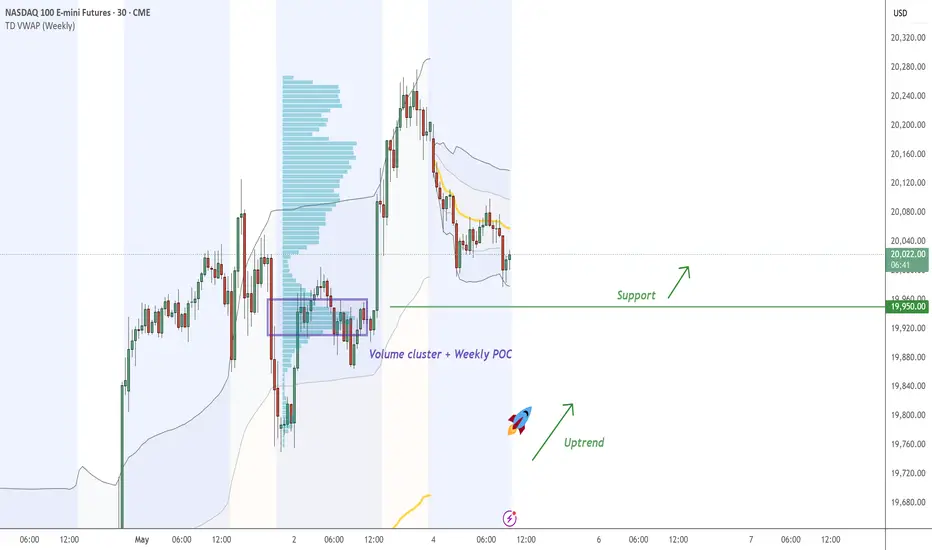
NQ continue with the UptrendOn NQ , it's nice to see a strong buying reaction at the price of 19950 .
There's a significant accumulation of contracts in this area, indicating strong buyer interest. I believe that buyers who entered at this level will defend their long positions. If the price returns to this area, strong buyers will likely push the market up again.
Uptrend and high volume cluster + Weekly POC are the main reasons for my decision to go long on this trade.
Happy trading
Dale
NQ1 - Did Bitcoin Just Call The Top ?NQ1
Has slumped since week open and printing and Evening Star candle pattern on the 4 hour chart.
So considering that it is in the retracement Golden Window (0.618 - 0.786) and also that Bitcoin is capitulating; this might just be the top here 👍.
Not advice

AMP Futures - Sync multiple chartsIn this idea we will demonstrate how to use the sync in layout feature with Tradingview.

Two Shots at NQ: Because One's Never EnoughAlright, here’s the game plan – because let’s be honest, the market loves nothing more than pretending to break out, then snapping back just to mess with us.
🔥 The Setup:
I’m eyeing the Micro E-mini Nasdaq-100 Futures (June 2025), and I’m giving myself two shots at this breakout. Yeah, I know – ambitious. But the market’s been playing hard to get lately, so I’m hedging my enthusiasm.
💡 Why Two Long Entries?
Because, let’s face it, the first entry will probably get stopped out. I like to think of it as a “testing the waters” trade. If it works, great – I’m a genius. If not, well, it was just practice.
First Entry (The Optimist):
I’m jumping in if it breaks out, keeping the stop tight – because nothing says confidence like a cautious stop loss.
Second Entry (The Realist):
If the first entry faceplants, I’ll wait for the market to freak out and then calm down. Then, I’ll slide back in when it looks like it’s actually serious this time.
🧠 Managing the Chaos:
Short-Term Target: The last high – because if it doesn’t clear that, what’s the point?
Long-Term Target: The equal move – assuming the market doesn’t chicken out halfway.
Stop-Loss: Snug and sensible, because I’d rather not watch my account do a disappearing act.
Take profit targets are set where the equal move would complete – assuming the market cooperates for once.
💭 The Thought Process:
I’m not here to pretend I can predict the future – if I could, I’d be on a yacht, not posting on TradingView. But this setup gives me two chances to be right, which is at least one more than usual.
🔥 Your Thoughts?
If you’re also giving your trades a second (or third) chance, drop a comment. Or just let me know how your latest breakout fake-out went – because misery loves company. 😅

NQ Range (05-12-25)Looks like it is "Rig in May and go Away". New range to watch would be the white arrow zone between the two orange TL's. The Channel below is a 2 standard deviation, NAZ should return to 19,750-18,750 at some point to retest. Looking for 21,256 to be next upper target for reaction. Flat NAZ YTD may do what, Run up 10-20%? or drop retest lower? Pick one. O/N group and Washington Street are very much in control here.

TRADE IDEA FOR NQSIMPLE TRADE IDEA, I like the OTE levels a lot, i think i may use them a lot in my future trading, however i wanna go through all the mentorships first, specifically 2016.

NASDAQ 2m Chart PO3 Acc, Manip Dist - Last Hour Party?Even though today has been crazy think a little sanity has setup for a classic ICT AMD play.
As of writing this we are in Accumulation. Watch for what appears to be a run higher, that gets hammered.
The last hour of the trading day on the 2m chart crosses above the 75 SMA, maybe it's pump time?
Check it out, gimmi feedback.
Thanks!
Craig

Nasdaq: The Rally Continues!The Nasdaq ended last week with strong upward momentum, moving swiftly toward the resistance at 20,694 points. Now it's getting interesting: once the index breaks above this mark, it should quickly enter our upper turquoise Target Zone (coordinates: 21,751 – 22,425 points), where we expect the peak of wave X in turquoise. Afterward, we anticipate a pullback during wave Y, which should aim for our lower turquoise Target Zone (coordinates: 17,074 – 15,867 points). The corrective magenta wave (4) should be completed there. However, if the Nasdaq directly surpasses the significant resistance at 23,229 points, our alternative scenario will take effect. In this 35% likely case, we would consider wave alt.(4) as already complete and locate the index in the impulsive wave alt.(5) .

#202518 - priceactiontds - weekly update - nasdaqGood Evening and I hope you are well.
comment: Bulls want at least 20536 now and run all the stops from before the big sell-off. Bears are not doing anything at all, so bulls will likely get it. This could be a breakout-retest and I marked the area for that with the red rectangle. Small chance bears come around next week but for now it’s too early to short and buying into 9 consecutive bull days is statistically beyond moronic.
current market cycle: trading range
key levels: 15500 - 23000 (upper range is a guess, could also become 21000 but for now we don’t know so I assume the higher price)
bull case: 20536 and then 21000. Those are the next targets and bulls are in full control of the market. The measured move from the buy spike at the lows is around 22350 and it’s possible that we get there. I think we need to see a pullback and how deep that will be. If we get only another sell spike and immediate buying for higher highs, we can also assume much higher prices. Above 21100 there is no reason not to go for 23000.
Invalidation is below 19100.
bear case: Bears have nothing. Below 19100 market is neutral but until then, selling this is dumb. Wait for more bears to appear or at least seeing something that resembles a topping pattern. Like a lower high on the 1h chart. Don’t try to be the lucky bear who shorted the exact high.
Invalidation is above 21100.
short term: Neutral. No interest in buying such a buy climax but it’s way too early for shorts. Patience is key.
medium-long term - Update from 2024-04-26: My most bearish target for 2025 was 17500ish. Now I assume we will be in a trading range 16000 - 23000 for much longer.

2025-05-06 - priceactiontds - daily update - nasdaq
Good Evening and I hope you are well.
comment: Clear trading range 19700 - 20300, don’t make it more complicated. We have FOMC tomorrow, then we will get a new impulse.
current market cycle: trading range
key levels: 19700 - 20300
bull case: Bulls defended the gap below to 19650 and prevent the bears from printing a bearish daily bear bar. Bulls are fine with the market correcting sideways, since that increases the odds of a continuation up and running the stops above the prior major lower high 20536. Bulls need to break above 20070 tomorrow or this could slowly become more bearish again, especially when we make lower lows below 197300.
Invalidation is below 19100.
bear case: Bears see it as a lower high major trend reversal and if they can stay below 20000, their odds increase to continue down. They broke below the first bull trend line and the next is around 19700 tomorrow. A strong 1h close below 19700 and I think more bulls will give up on this bounce.
Invalidation is above 20100.
short term: Neutral. Continuation in given range is expected until FOMC. I don’t know if Jpow can really move this but let’s see. Don’t gamble.
medium-long term - Update from 2024-04-20: My most bearish target for 2025 was 17500ish, given in my year-end special. We are +18% from the lows and I do think, once this turns again, it will easily be the short trade of the year.
trade of the day: Short since Globex open since Market could not get above 1h 20ema for 299 points down.

NQ KEY ICT LEVELS - 6th MAY 2025Levels marked on the chart using my free indicator which marks out all of the ICT key levels which can be used for potential POIs where price might react

NQ KEY LEVELS - 6th MAY 2025Key levels marked by using low volume nodes for potential key levels where we may see price react.

#202519 - priceactiontds - weekly update - nasdaqGood Day and I hope you are well.
comment: Not much changed last week so I do not change much of what I wrote then. Bulls want at least 20536 now and run all the stops from before the big sell-off. Bears are not doing anything at all, so bulls will likely get it. This could be a breakout-retest and I marked the area for that with the red rectangle. Small chance bears come around next week but for now it’s still too early to short. The bull wedge is about to break out over the next 1-2 days and if bulls stay above 19600, we should expect higher prices.
current market cycle: trading range
key levels for next week: 19000 - 21000
bull case: 20536 and then 21000. Those are the next targets and bulls are in full control of the market. The measured move from the buy spike at the lows is around 22350 and it’s possible that we get there. I think we need to see a pullback and how deep that will be. If we get only another sell spike and immediate buying for higher highs, we can also assume much higher prices. Above 21100 there is no reason not to go for 23000. Nothing of this changed to last week. Bulls preventing the bears from getting any decent pullback, which is uber bullish.
Invalidation is below 19100.
bear case: Problem for the bulls is, that we have not closed above the weekly 20ema for two weeks now and bears defending the prior lower high 20536. That was and will be my line in the sand next week. Gap close to it, we have no reason not to print a new ath but below19600 I think more bulls will give up, depending on the strength of the selling. As of now, nothing about the chart is bearish but one decent down day > -2% could change that.
Invalidation is above 20620ish.
short term: Neutral. Market went nowhere and trading on hope and fairy dust is not my thing. I wait.
medium-long term - Update from 2024-05-11: My most bearish target for 2025 was 17500ish. Now I assume we will be in a trading range 16000 - 23000 for much longer. Same update as for dax, I guess we could go down and sideways over the next weeks/months and then have another squeeze into year end. Stairs up, elevator down.
