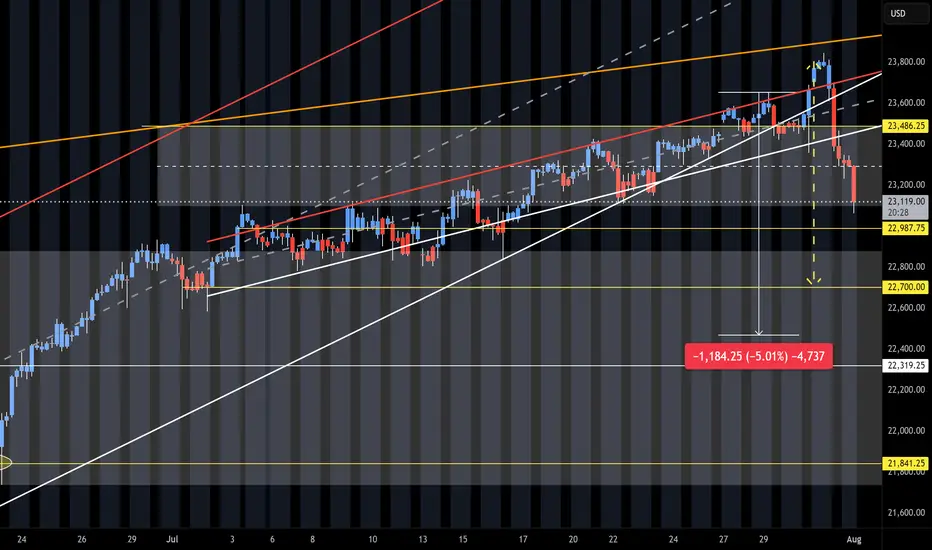
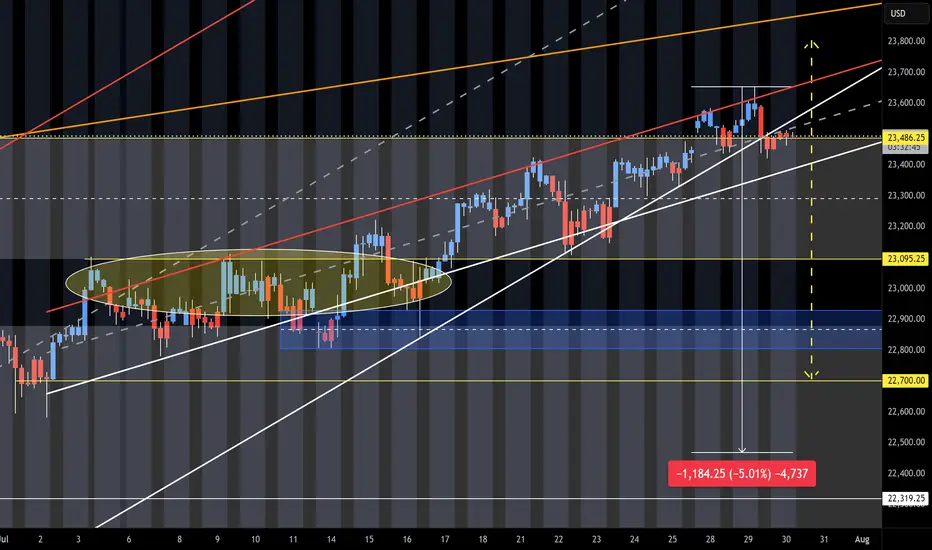
NQ Targets (08-04-25)Many calls did play out last week and looking for some targets to get tested this week. On 7/29 called the Yellow arrow (last week's called range), the white is this week's. NDX has some gaps to retest, YTD chart below and yellow arrows are the targets.
The 30M and 4HR charts are adjusted to match the NDX gaps.
Anyway, the Overnight will be used to redirect the NAZ back up after most drops, this is normal and just beware of the O/N Pump/Dump once the Reg Session starts. Washington Street will spin, Fire, Tweet and do whatever works to get NAZ back above the DZ 23,486. Just watch the Queen spiral out of control should it not. The two day drop erased 23 trading days and those buyers are now loosing money. Should it not come back, the buyers that did not sell (trapped) will sell and send this even lower. Games/tricks can not fix that.
NQU2021 trade ideas
NQ Short (08-01-25)The 5% pull back is playing out. We had the heavy selling after the O/N Pump/Dump into the selling of the Reg Session and Outside Day Reversal. Up for weeks and down in hours. Next break down will have to be the failure of the long standing Friday into Monday Long Play. We did get the reg session selling and now O/N selling. Looking for the trifecta and failed F-M move. Long Trap is active. Just watch the timely Tweets and Tricks at KL's.
NASDAQ at Key Turning Point 🔍Technical Context
After testing the 23,600–23,800 supply zone, price printed a strong bearish rejection with a weekly engulfing candle.
The RSI broke decisively below the midline, signaling a clear loss of momentum.
Price is now trading back within the weekly demand zone between 22,800 and 22,950.
If a pullback toward 23,200 occurs, it could offer a fresh short opportunity, with downside targets around 22,600.
🪙 COT Report – July 29
Non-Commercials (speculators):
Long: +8,581
Short: +4,355
Commercials (hedging):
Long: +4,955
Short: +8,556
The market remains net long, but commercials are increasingly hedging with shorts.
The current imbalance — 88.6% long vs 11.3% short — suggests excessive bullish positioning, raising the risk of a correction.
🗓️ Seasonality – August
August is historically strong for the NASDAQ:
+222 pts (10Y)
+400 pts (5Y)
+912 pts (2Y)
While the trend is clearly bullish seasonally, caution is warranted:
Tops are often formed during the first half of August, followed by more pronounced corrections in September.
📉 Operational Summary
Primary scenario:
Wait for a retest of the 23,200–23,250 area
Look for rejection signals → enter short
Target 1: 22,800
Target 2: 22,600
Alternatively:
If 22,800 breaks on a strong weekly close, deeper downside scenarios may unfold.
How to Use Engulfing Candles in TradingViewEngulfing patterns are among the most powerful candlestick formations because they signal strong momentum shifts and can help you spot dramatic trend reversal opportunities.
What You'll Learn:
• How to identify valid engulfing formations where one candle completely covers another's body
• The two types: bullish engulfing (green candle engulfs red) and bearish engulfing (red candle engulfs green)
• Psychology behind engulfing patterns: when one side completely overwhelms the other
• Using volume analysis to confirm engulfing pattern validity
• Finding meaningful engulfing patterns at trend highs and lows for reversal setups
• Timeframe considerations for engulfing analysis on any chart period
• Step-by-step trading strategy for engulfing reversal setups
• Setting proper stop losses above engulfing candle highs
• Determining profit targets below engulfing candle lows
• Managing wide-range drawdowns common with strong momentum shifts
• Advanced entry technique: waiting for retracements to improve risk-reward ratios
This tutorial may help futures traders and technical analysts who want to use powerful candlestick patterns to identify significant momentum changes.
The strategies covered could assist you in creating effective reversal setups when strong buying or selling pressure appears at key price levels.
Learn more about futures trading with Tradingview: optimusfutures.com
Disclaimer:
There is a substantial risk of loss in futures trading. Past performance is not indicative of future results. Please trade only with risk capital. We are not responsible for any third-party links, comments, or content shared on TradingView. Any opinions, links, or messages posted by users on TradingView do not represent our views or recommendations. Please exercise your own judgment and due diligence when engaging with any external content or user commentary.
This video represents the opinion of Optimus Futures and is intended for educational purposes only. Chart interpretations are presented solely to illustrate objective technical concepts and should not be viewed as predictive of future market behavior. In our opinion, charts are analytical tools—not forecasting instruments. Market conditions are constantly evolving, and all trading decisions should be made independently, with careful consideration of individual risk tolerance and financial objectives.

Nasdaq outlook on the weekly.... Where will price go next?Market cycle outlook on the year :
We have now reached a new month.
August 1st, which a new market cycle for the month to form, along beginning the backend of the year 2025 and the front end of a new week coming.
Closed bearish this week along with hitting all time highs once again for the Nasdaq.
NASDAQ 100 LOOKING OVERBOUGHT RIPE FOR A CORRECTION?Hey Traders so today was looking at the Nasdaq 100 and it seems like it's approaching overbought territory at all time highs.
Of course no one knows what earnings season will bring and seasonally historically August is normally a good month for stocks.
So if we look at previous rallies market seems to correct eventually 3% or 4%. I think that is actually healthy for the market also.
So if your bullish watch for 3% correction and buy back in around 22,800-23,000 put a stop under support at around 22,000-22,500. Hopefully the market won't make it that far on a sell off so odds of getting stopped out are low I think.
However if you are Bearish I don't reccommend selling at All Time High. Best odds for stronger selloff I think is waiting until September as it is historically the weakest month of the year for stocks seasonally.
Good Luck & Always use Risk Management!
(Just in we are wrong in our analysis most experts recommend never to risk more than 2% of your account equity on any given trade.)
Hope This Helps Your Trading 😃
Clifford

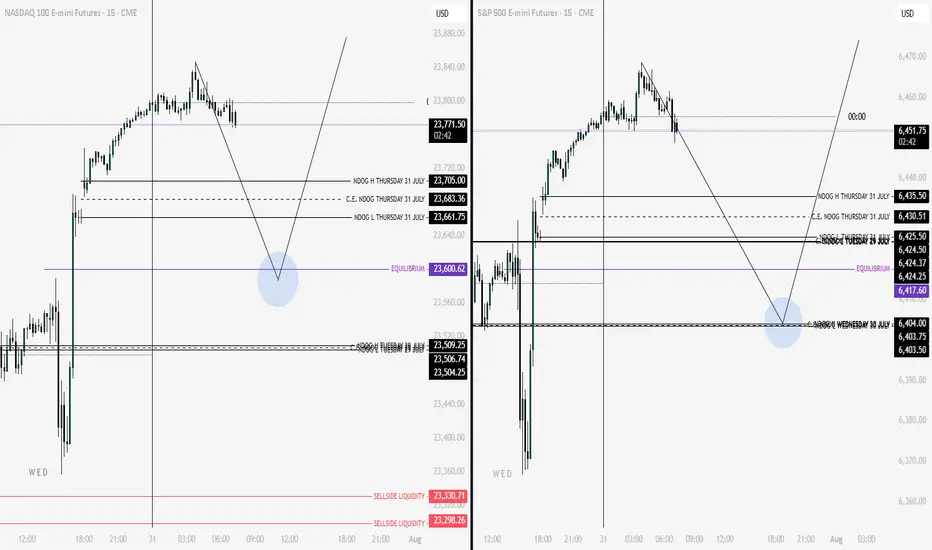
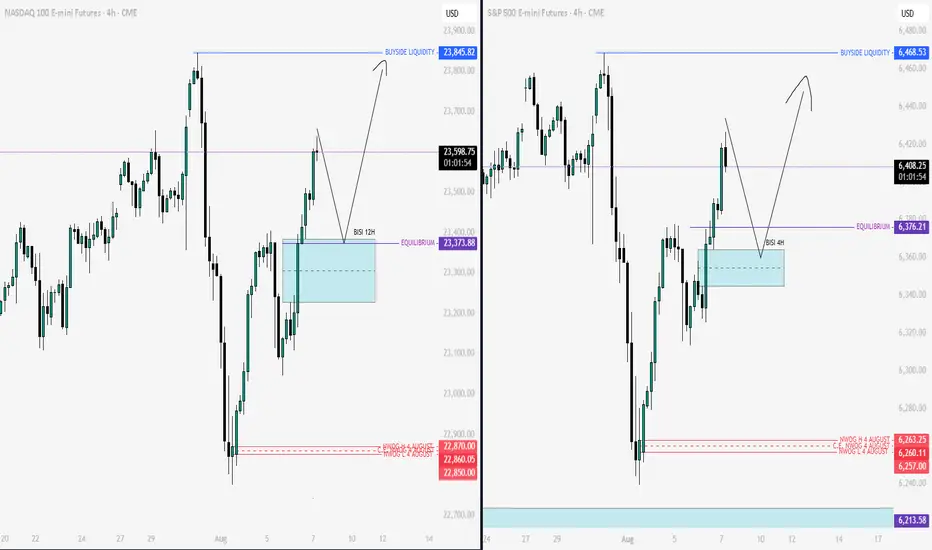
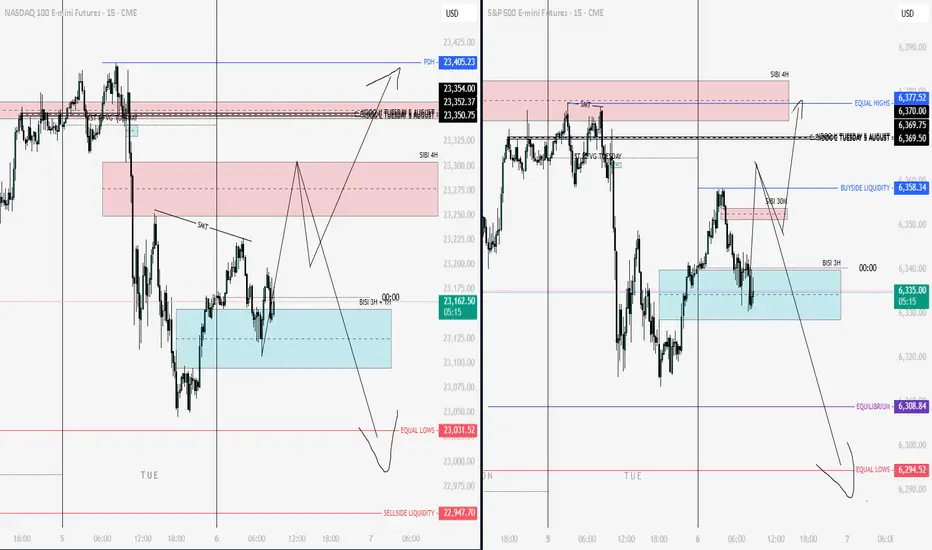
Nq & Es Key Levels & Scenarios 07-08-2025It’s clear that we’re currently operating within a premium zone of the range. The directional bias remains bullish, but I’m anticipating the potential for a short-term short setup around the 09:30 AM New York open, allowing for a retracement before continuation higher.
I will not look for long setups unless price trades back into a discount zone, or at the very least, rebalances toward the equilibrium (50% of the dealing range). If price continues to rally without offering such a pullback, I’m fully prepared to stay sidelined — discipline over FOMO.
Wishing everyone clean, high-probability setups today.
Calm Before a StormSince the post-COVID period, we have not seen such a gentle and continuous uptrend. This phenomenon reminds me of the market before the COVID meltdown.
How do I going to interpret this "Gentle & Continuous Uptrend" move?
My answer: Cautiously bullish
Back then, market was cautiously bullish because COVID seemed to be contagious.
It has triggered.
Now, market is cautiously bullish because tariffs appear to be deepening inflation. With slowing job numbers, this is becoming a bigger concern.
Will it trigger?
Mirco Nasdaq Futures and Options
Ticker: MNQ
Minimum fluctuation:
0.25 index points = $0.50
Disclaimer:
• What presented here is not a recommendation, please consult your licensed broker.
• Our mission is to create lateral thinking skills for every investor and trader, knowing when to take a calculated risk with market uncertainty and a bolder risk when opportunity arises.
CME Real-time Market Data help identify trading set-ups in real-time and express my market views. If you have futures in your trading portfolio, you can check out on CME Group data plans available that suit your trading needs www.tradingview.com

NQ Short (07-28-25)The F-M Long Rig is active with a Gap Up and Pump/Dump play. Just notice KL 486 and how/when the NAZ gets above. In O/N, the Reg Session and previous hits at 23,440 got rejected and is why you are seeing the move in the off session. The BTD/FOMO chase is active, Pump/Dump near Open today for next move.
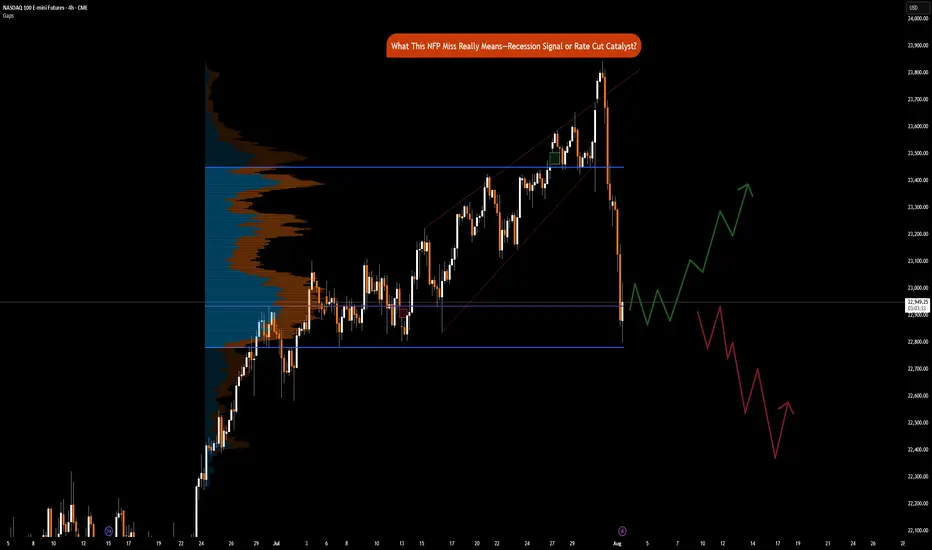
NFP Miss Implications: Recession Signal or Rate Cut CatalystCME_MINI:NQ1! CME_MINI:ES1! CME_MINI:MNQ1!
Happy Friday, folks!
Today is the first Friday of August, and that means the highly anticipated Non-Farm Payroll (NFP) numbers came in at 7.30 am CT.
US Non-Farm Payrolls (Jul) 73.0k vs. Exp. 110.0k (Prev. 147.0k, Rev. 14k); two-month net revisions: -258k (prev. +16k).
Other key labor market indicators were as follows:
• US Unemployment Rate (Jul) 4.2% vs. Exp. 4.2% (Prev. 4.1%)
• US Average Earnings MM (Jul) 0.3% vs. Exp. 0.3% (Prev. 0.2%)
• US Average Earnings YY (Jul) 3.9% vs. Exp. 3.8% (Prev. 3.7%, Rev. 3.8%)
• US Labor Force Particle (Jul) 62.2% (Prev. 62.3%)
Data and Key Events Recap:
What a year this week has been! It's been packed with high-impact economic data and pivotal central bank decisions, especially from the Federal Reserve. On top of that, trade and tariff announcements have dominated the headline.
U.S. economic data this week was broadly strong. Second-quarter GDP came in at 3.0%, beating expectations and signaling solid growth. The ADP employment report also surprised to the upside, printing 104K vs. the 77K forecast. Consumer confidence showed resilience as well, with the Conference Board’s reading rising to 97.2.
Inflation data was mixed but mostly in line. Core PCE for June rose 0.3% MoM, while the YoY reading ticked up to 2.8%, slightly above the expected 2.7%. The broader PCE Price Index also came in at 0.3% MoM, with a YoY print of 2.6%, slightly higher than forecast.
The Federal Open Market Committee (FOMC) voted to keep the federal funds rate target range unchanged at 4.25% – 4.50%. Notably, Governors Waller and Bowman dissented, favoring a 25-basis-point rate cut as expected, however, marking the first dual dissent by governors since 1993.
Changes to the FOMC Statement included a downgraded assessment of economic growth, reflecting slower real consumer spending. The Committee reiterated that uncertainty around the economic outlook remains elevated. It maintained its view of the labor market as "solid" and inflation as "somewhat elevated." Forward guidance remained unchanged, emphasizing the Fed’s readiness to adjust policy as necessary while continuing to monitor risks to both sides of its dual mandate.
Here’s a summary of key points from the FOMC press conference:
• On current policy stance:
“We decided to leave our policy rate where it’s been, which I would characterize as modestly restrictive. Inflation is running a bit above 2%... even excluding tariff effects. The labor market is solid, financial conditions are accommodative, and the economy is not performing as if restrictive policy is holding it back.”
Chair Powell commented on the need to see more data to help inform Fed’s assessment of the balance of risks and appropriate Fed Funds rate.
• On labor market risks:
“By many statistics, the labor market is still in balance... You do see a slowing in job creation, but also a slowing in the supply of workers. That’s why the unemployment rate has remained roughly stable.”
• On inflation and tariffs:
“It’s possible that tariff-related inflationary effects could be short-lived, but they may also prove persistent. We’re seeing substantial tariff revenue—around $30 billion a month—starting to show up in consumer prices. Companies intend to pass it on to consumers, but many may not be able to. We’ll need to watch and learn how this unfolds over time.”
Trade Headlines:
US President Trump announced tariffs on countries ranging from 10%-41%. Average US tariff rate now at 15.2% (prev. 13.3%; 2.3% pre-Trump), according to Bloomberg. US officials said that if the US has a surplus with a country, the tariff rate is 10% and small deficit nations have a 15% tariff, US officials said they are still working out technicalities of rules of origin terms for transshipment and will implement rules of origin details in the coming weeks. No details on Russian oil import penalty. Sectoral Tariffs White House said new reciprocal tariff rates take effect on Friday. Although Canada’s tariffs were increased to 35%, excluding USMCA goods, the effective rate is only 5%.
The economic data is showing strength, on the contrary, tariffs announcements for most countries have now been announced. Investors need to consider that tariffs are not just a tool to reduce trade deficit, it is also a geopolitical tool presently being used to shape alliances. The US wants to soften BRICS, China and Russian influence on the world stage.
Key to note is that these tariffs are substantially lower than what was announced on April 2nd, 2025.
The key question now remains, do participants buy the dip or ‘sell the fact’ is the current playbook?
Market Implications
Given the prior revisions in NFP data of -258K, July’s payroll came in at 73K, missing forecasts of 110K. What does this mean for markets? Markets are now pricing in 75% chance of a September rate cut. Prior revisions along with the current job market slowing down imply that risks to the downside are substantially increasing. Fed’s current policy is not just moderately restrictive but rather it may likely tip the US into a recession if Fed Funds rates remain elevated. The Chair asked to see more data, and here it is but I do wonder why they did not take this data into account for the July meeting. Surely, it would have been available to them.
Another question to ask would be, is it due to defiance of rate cut calls by the US administration? Is the Fed already behind the curve?
Fed’s dual mandate targets inflation and maximum employment. While inflation is sticky, the Fed may need to abandon their 2% mandate in favor of average inflation of 2.5% to 3%. A less restrictive policy will provide needed stimulus along with the fiscal stimulus provided via the BBB bill.
This drastically changes, in our analysis, how investors position themselves heading into the remainder of the year.
Markets (equities) may retrace slightly but the dip in our opinion will still be the play given weaker labor market data and increased rate cut bets. The bad news here means that the Fed has the data it wants to see to start cutting. Market pricing in 2 cuts seems to be the way forward for now.
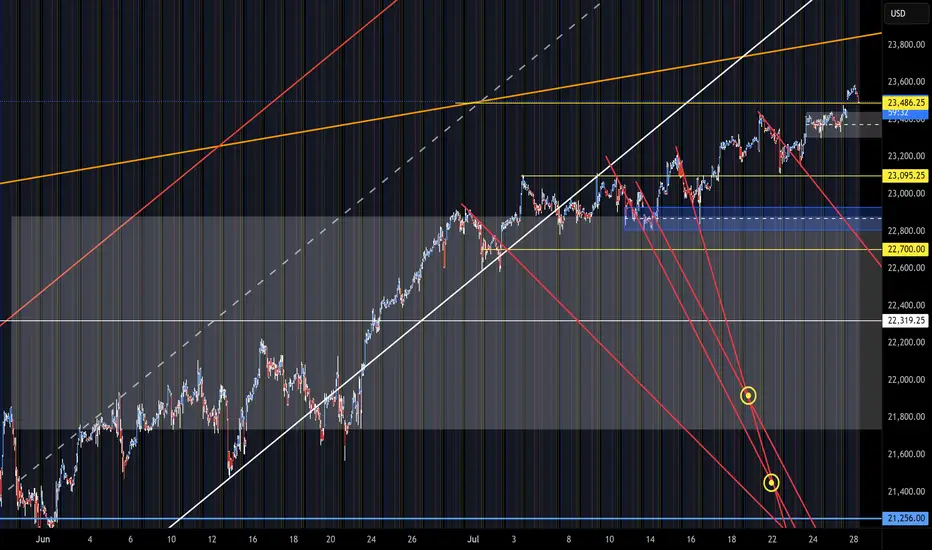
NAS100 ShortNAS100 is now net short on the regression break.
I am short the RTY and I considering this options as well.

NQ Short (07-30-25)NAZ is at upper target and Turn Zone from May 12th post. Failure here should see a 5% drop test. The idea is that buyers will need some sellers in order to get higher. The sellers will help to test the level strength. Month end into a Friday-Monday Long play and a break in this long standing pattern may create the opposite. Current danger zone is the 23,486 KL. Look Long above and short below. Scalping Shorts should turn to holding shorts and scalping Longs. Expect timely Tweets and same old Tricks near or under the DZ. O/N is still The BOSS until both the O/N and Reg Session sell (on same day).
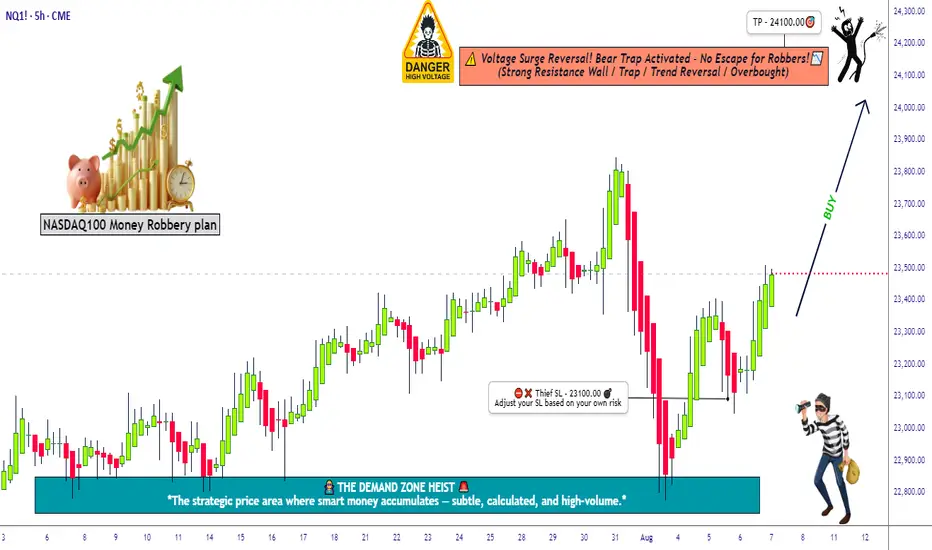
Robbing the Nasdaq Futures | NQ1! Plan with Precise Targets💥🚨NQ1! “E-Mini Nasdaq 100” Heist Alert 🚨💥
🎯Thief Trader Bullish Takeover Plan🕵️♂️📈
🌍 Dear Global Looters & Market Bandits, 💰💸💎
It's time to crack the vaults of the Nasdaq 100 Futures (NQ1!) — Thief-style! No mercy. No fear. Just profits. 🔥
🔓 The digital vault is open — we’re layering multiple limit orders like pros to snatch the tech treasure chest. This isn’t just a trade…
👉 This is an organized robbery of Wall Street’s most elite index. 🏦🕶️
💎 Entry Point = Anywhere on the Grid!
Set your buy limit orders at juicy dips — 15m / 30m / 1H zones, support bounces, or wherever the chart whispers "steal me." 🎧📉
⏰ Stay alert — we don’t chase, we trap. 🐍
🛑 Stop Loss = 23100.00
Set it & forget it below key swing low.
You’re not in this heist to bleed. Risk small. Layer tight. Protect the stash. 🛡️💼
🎯Target = 24100.00
That’s the exit zone before the feds (aka market makers) catch on.
Be smart — take profit early if the heat gets real. 🚓🚨
🧠Strategy Mode: Layering Limit Orders
Thief never enters with one shot. We layer in like ghosts — scaling into value zones, controlling the risk, and building power before liftoff. 🚀📊
This ain’t gambling — it’s structured robbery with exit plans. 🎯💼
🧲 Scalpers & Swingers Welcome!
⚔️ Got big capital? Smash the levels and ride the breakout.
💼 Small cap thief? Ride with the swing crew — safer, smoother, more stealthy.
📍Always use Trailing SL — never let the market take back what you stole. 💰
📰 Market Sentiment: Bullish Bias 😈
AI hype. Earnings season. Rate cuts. You name it — it’s all fueling the Nasdaq rocket.
We’re riding momentum, not hope. This ain’t luck — it’s Thief precision execution.
🔔 Pro Thief Tips:
⚠️ Avoid entries during high-impact news.
🚀 Use alerts. Monitor VIX + QQQ.
💻 Watch for liquidity zones & trap setups.
🚀💣 Smash that 🔥Boost Button🔥 if you love robbing the market like a pro!
Help grow the Thief Trading Crew — one like = one stolen candle from the whales. 💵🦈
We rob institutions, not each other. 💯🤝
Stay locked in — next heist plan coming soon. 📡📈
#NQ1 #Nasdaq100 #EminiFutures #ThiefTrader #RobTheMarket #LayeringStrategy #SmartMoneyMoves #BullishPlan #WallStreetHeist #TradingViewSetup
NQ heading back to weekly AVL🕵️ Chart Overview
• Instrument: MNQ1! (Micro Nasdaq Futures, continuous contract)
• Timeframe: 4H
• Method: Volume Profile + Price Action + Supply/Demand
⸻
🔷 Technical Commentary
Entry Zone
• Price Range: 23,463.25 – 23,608.25
• Context: Clearly marked supply zone formed after a strong rejection wick and drop, likely a mitigated order block or an area with resting sell orders.
• Price recently tapped into the bottom edge of this zone and is showing signs of reaction.
• You’re targeting this as an ideal short re-entry point on a retracement move.
Confluence Factors
• Volume Profile: High volume node (HVN) just below the entry zone, suggesting this area previously acted as fair value before price got rejected.
• Structure: Bearish internal structure shift after that strong swing high. Price created a lower high and lower low, supporting the short idea.
• Clean break & retest: You’ve waited for the pullback to a previous area of interest—textbook risk-efficient trading.
TP Area
• Target Range: ~22,800s zone
• Likely drawn from:
• Previous demand area
• Volume gap / low-volume node
• Strong bounce from this zone last time suggests it’s a key support.
• Gives a nice 2–2.5R setup, depending on your SL.
⸻
🧠 Trade Logic Summary
• Bias: Bearish
• Entry: Short within the 23,463.25 – 23,608.25 zone (watch for rejection wicks / internal breakdown on LTF).
• Confirmation: Price reaction or reversal pattern in the zone (e.g., bearish engulfing, LTF BOS).
• TP: 22,800 region (just above the previous demand zone)
• SL: Just above 23,608.25 to invalidate the idea.
⸻
✅ Strengths
• Clear market structure shift
• Volume Profile confirmation
• Defined RR with institutional-style entry
• Good use of supply zone logic (not chasing entries)
⸻
⚠️ Things to Monitor
• If price closes above 23,608, setup invalidates and you may be looking at a liquidity grab and continuation to 23,800+
• Watch for bullish absorption in your entry zone. That would be a red flag.
• NFP / FOMC or any other scheduled macro events? Check the calendar before execution.


NASDAQ 100 BOUNCE OFF SUPPORT FROM BUY ZONE!Hey Traders so today looking again at the Nasdaq 100 looks like we got a bounce right off the level of support that I thought it could hold 22,806.
Why that level?
I trade off the daily charts so every candle is one day and I believe that price action is everything in these markets it's all about support and resistance. The market tried 9 days to test that level from 07/03-07/15. But it kept getting rejected then it rallied off it so I just felt that maybe thats a level that the market might halt some of the selling. Ok so maybe I got it right yay!
Guess what? Sometimes we will get it completely wrong! So getting market direction right is only half the battle. The key is risk management.
I have learned it's not how we enter a trade that counts but how we exit. Can we get out with a profit? Ok enough of the classroom for today. 🤓
So where are we market bounced off support at 22,800 yes you are in profit if you took buy zone but we also have risk still in the trade so I say lower the risk by moving the stop about half way up from 22,533 to 22,700. That way if there is a market reversal we don't get stopped out at full loss. Then try to stay 3 days behind the market so it has room to breathe if it can test the all time high again at 22,830 that would be a great place to take some profits!
This is the way I stay 3 days behind the market. But if you have another profit strategy that works better then continue to do what works for you.
However if bearish way until market breaks a strong support level before consider selling into rally.
COT REPORT
LARGE SPECS = NET LONG 34,954
So lets see what happens this week.
Good Luck & Always use Risk Management!
(Just in we are wrong in our analysis most experts recommend never to risk more than 2% of your account equity on any given trade.)
Hope This Helps Your Trading 😃
Clifford

NQ & ES Key Levels 06-08-2025"To determine which of the two scenarios is more likely to play out, we first need to see how the market opens. Based on the price action and how key levels are respected, we’ll gain clarity on the setup we’re looking for. Price is currently at a critical point, with probabilities at roughly 50-50 — so there’s no clear bias yet. However, we’re well aware of the key levels and zones we’re focused on."
NQ Power Range Report with FIB Ext - 8/4/2025 SessionCME_MINI:NQU2025
- PR High: 22915.75
- PR Low: 22821.75
- NZ Spread: 210.0
No key scheduled economic events
Session Open Stats (As of 12:35 AM 8/4)
- Session Open ATR: 286.24
- Volume: 43K
- Open Int: 272K
- Trend Grade: Long
- From BA ATH: -3.6% (Rounded)
Key Levels (Rounded - Think of these as ranges)
- Long: 23811
- Mid: 22096
- Short: 20383
Keep in mind this is not speculation or a prediction. Only a report of the Power Range with Fib extensions for target hunting. Do your DD! You determine your risk tolerance. You are fully capable of making your own decisions.
BA: Back Adjusted
BuZ/BeZ: Bull Zone / Bear Zone
NZ: Neutral Zone
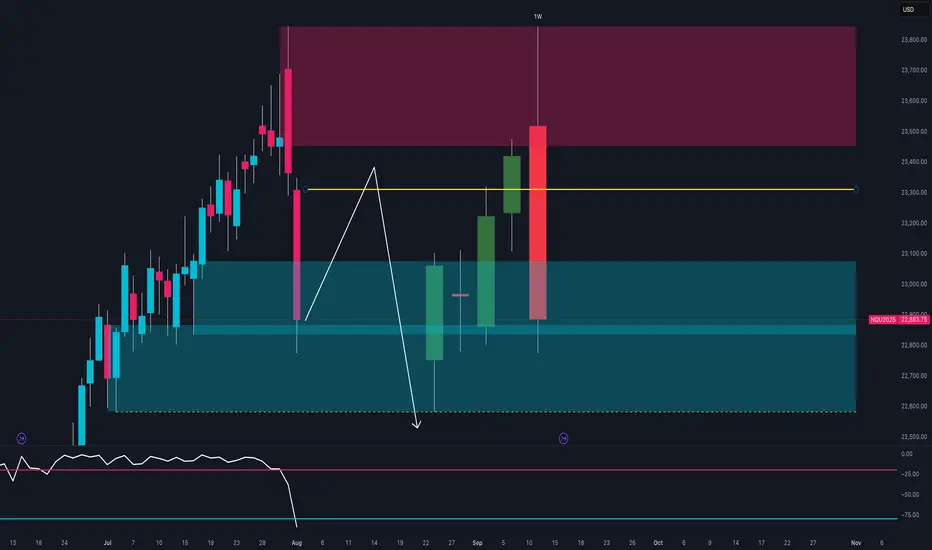
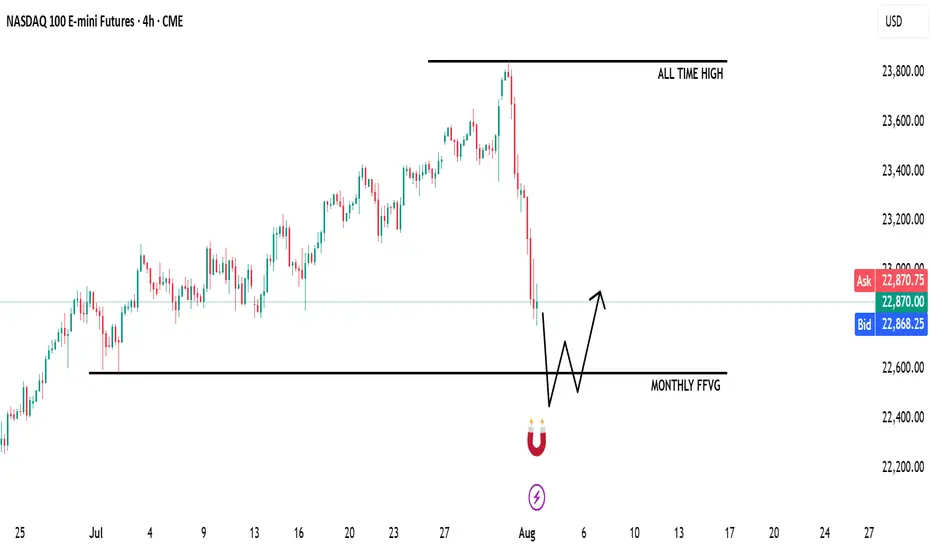
NQ | NASDAQ - Weekly Recap & Gameplan - 03/08/25📈 Market Context:
The market is pricing in a potential 0.25% rate cut in the September FOMC meeting, keeping the overall structure bullish.
Although we saw a retracement after the Non-Farm Employment Change came in weaker than expected, bullish sentiment remains intact.
Currently, market sentiment has shifted to neutral from last week’s greed. Augusts are often choppy and prone to retracement/accumulation, but structurally, bulls still hold the upper hand.
🧾 Weekly Recap:
• NQ started the week strong with price discovery, pushing higher from Monday to Thursday.
• Eventually, price ran a key 4H swing liquidity, which led to another all-time high.
• That move was followed by the start of a healthy retracement, signaling short-term distribution.
📌 Technical Outlook & Game Plan:
→ I'm expecting price to run into the Monthly Fair Value Gap — a major liquidity magnet in my model.
→ That move could generate significant bullish energy — at least a short-term bounce, if not a full reversal.
→ Until then, I remain bearish targeting 22,583 (my marked black line).
🎯 Setup Trigger:
After price takes 22,583, I’ll watch for:
• 4H–1H break of structure (BOS)
• Formation of fresh demand zones
→ Upon LTF confirmation, I’ll look to go long aiming for another test of all-time highs.
📋 Trade Management:
• Stoploss: Below the 1H–4H demand zone
• Target: Trailing stop strategy; aggressive profit-taking on the way up
• Note: Final target could be all-time highs, but I’ll manage the position actively
💬 Like, follow, and comment if this outlook adds value to your trading. Educational content and more setups are coming soon — stay tuned!

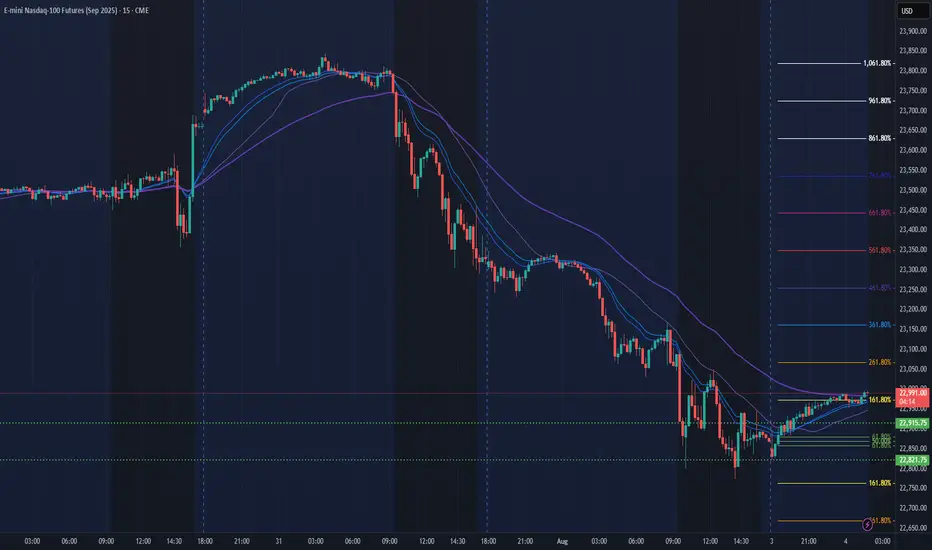
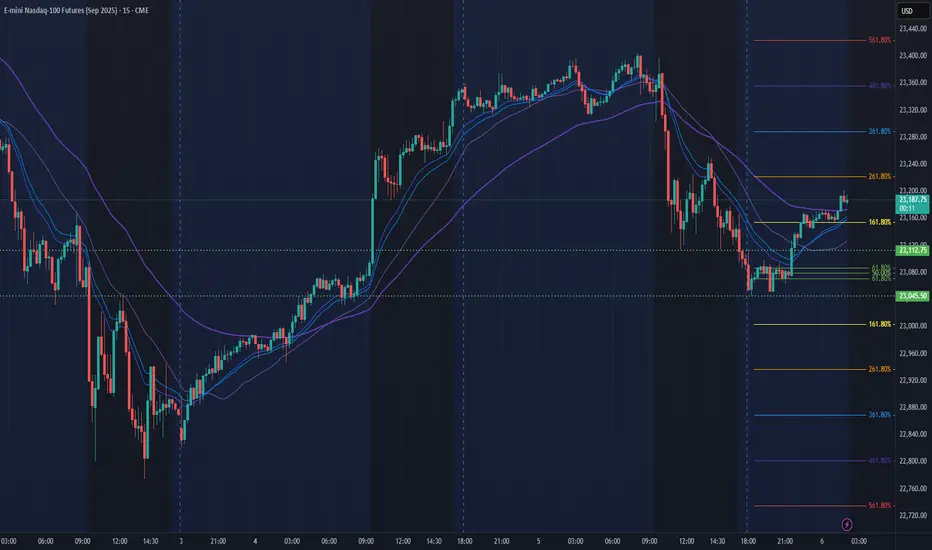
NQ Power Range Report with FIB Ext - 8/6/2025 SessionCME_MINI:NQU2025
- PR High: 23112.75
- PR Low: 23045.50
- NZ Spread: 150.25
Key scheduled economic events:
10:30 | Crude Oil Inventories
13:00 | 10-Year Note Auction
Look above & fail Friday-Monday highs
Session Open Stats (As of 12:35 AM 8/6)
- Session Open ATR: 299.58
- Volume: 32K
- Open Int: 277K
- Trend Grade: Long
- From BA ATH: -2.8% (Rounded)
Key Levels (Rounded - Think of these as ranges)
- Long: 23811
- Mid: 22096
- Short: 20383
Keep in mind this is not speculation or a prediction. Only a report of the Power Range with Fib extensions for target hunting. Do your DD! You determine your risk tolerance. You are fully capable of making your own decisions.
BA: Back Adjusted
BuZ/BeZ: Bull Zone / Bear Zone
NZ: Neutral Zone
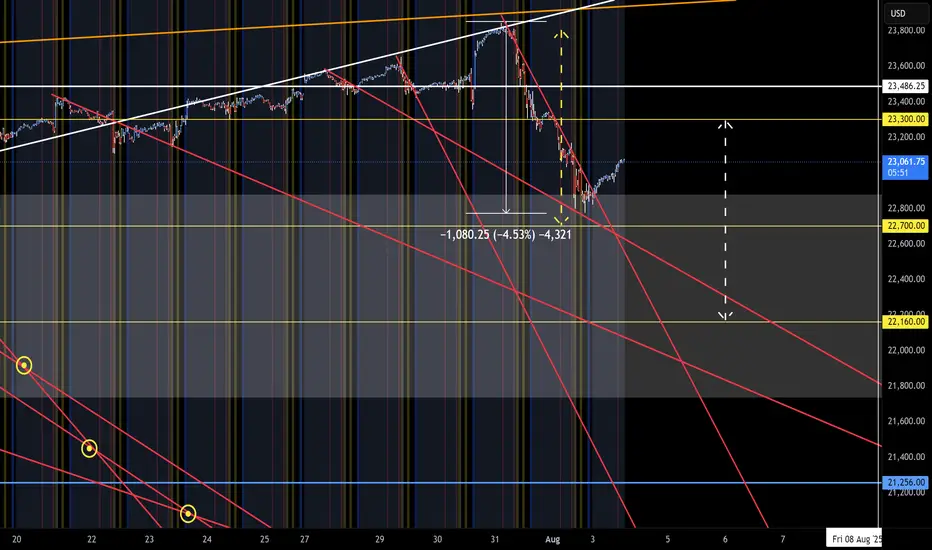
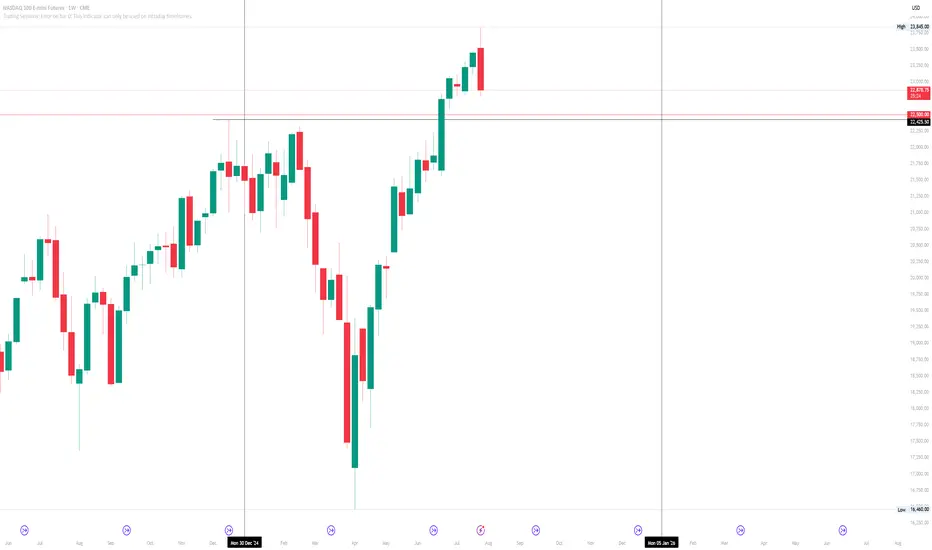
NASDAQ Futures (/NQ) Outlook – Weekly Chart As of August 1,2025NASDAQ Futures (/NQ) Outlook – Weekly Chart
As of August 1, 2025
Current Price: 22,915.75
RSI (14): 61.34 – momentum remains bullish, but cooling off
🧭 Short-Term Outlook:
The recent weekly candle shows strong rejection and a -2.16% drop, suggesting a possible correction phase.
Price is now heading toward the 0.236 Fib retracement zone (~22,120) — a logical short-term support.
If this level doesn't hold, the next major support sits around the 0.382 zone (~21,045), aligning with your second expected zone (~21,000).
🛑 Support Levels to Watch:
~22,120 – Fibonacci 23.6%, prior structure zone
~21,000–21,045 – Confluence with 38.2% Fib + former resistance
~20,175 – 50% retracement, deeper retest if sentiment shifts
Mid-Term Bias (Q4 2025 Outlook):
After this pullback phase, your projected path implies:
A bullish resumption from the support levels (likely from 21k–22k zone)
Consolidation into Q4
A breakout continuation toward new highs above 24,000 into 2026
This outlook remains valid as long as 20,000 holds — a clean invalidation point for medium-term bulls.
Also, whenever the daily Candle closes above high of thid week which is the ~23845 points , this outlook become invalid too.

Nq and Es Key Levels Prediction 31-07 As long as we are above the purple line ( Equilibrium ), I will look for short opportunities, but as soon as we touch or pass a little below the purple line, I will also look for long opportunities.