#202516 - priceactiontds - weekly update - wti crude oilGood Evening and I hope you are well.
comment: Expanding triangles are my least favorite structure and we are in one. I have no bias here because both sides have reasonable arguments. Bulls just want this selling to become a bear trap and test up to the upper bear trend line around 69 and bears can see it as a bear flag that tested the 50% retracement of this bear leg.
current market cycle: trading range on the monthly chart - daily chart is a bear trend that could be transitioning into a trading range again
key levels: 55 - 69
bull case: Bulls see it as a failed acceleration down and want to retest the prior bear trend line around 68. Same target as last week but this week they closed the weekly bar above 64 which was my line in the sand. If they continue here, they will likely squeeze much higher again. 69 next target.
Invalidation is below 60.
bear case: I give the bears one more day to form a strong reversal but the odds are low. This breakout could go much higher and Friday looks like a give-up bar. Argument for the bears is that we are still at the 50% retracement and the breakout-retest of the March low 64. Any prices above 64.2 is invalidation for the bears. I will only view this as bearish again, if bears break the bull trend line from the 54.48 low and that’s currently around 61.
Invalidation is above 64.2.
short term: Neutral at 64. Above 64.2 bullish and only below 61 I think bears have taken control again.
medium-long term - Update from 2025-04-20: This does look like another bear trap below 60, which was to be expected. Depending on next week I will write some more here. For now It’s still a bear trend until bulls can reclaim 72.
NQ1! trade ideas

#202516 - priceactiontds - weekly update - nasdaq
Good Evening and I hope you are well.
comment: Neutral and very similar to dax, as most of the time. I do think we will see one more leg down in this current bear trend before we could go sideways for longer, until earnings become the absolute fucking shitshow I expect them to become. We get daily news about big companies not exporting to China or to the US due to tariffs. No one believes this will go down smoothly. Bear trend line holding so far, 50% retracement for this bear trend was 19483 and the spike high last week was 19388 and bulls could not get above it this week. The daily 20ema is also right above us and every time market touched it, we sold and closed below. Triangle will likely break on Tuesday and I am having wet dreams about going below 17000 again.
current market cycle: bear trend but above 19388 it ends and we will be in a giant trading range
key levels: 15500 - 19500
bull case: Bulls want this trend to end and crush the hopes for a third leg down. That has not changed. Their only target is 19388 and if they get it, market is completely neutral and they will likely go for 20000 again. Bulls still have the triangle argument but below 18100 that is gone as well. At this point I think only very positive news could save the bulls. Market is likely waiting for big earnings next week and if Tesla surprises downwards, we will hopefully crash this m* again.
Invalidation is below 18000.
bear case: Last week my assumption was that the tariff exemptions were enough to pump this above the bull spike from the previous week but that failed and we went lower since. If even that can not lift the market to higher highs, what will? Only a big agreement with the EU and/or China. How likely is that? This US government doesn’t even know how to articulate their goals in negotiations, how do you think you could guess it? Market is in maximum limbo and since we are still somewhat high enough, we could see more risk-off trading. Until bears can get below 18000, we likely continue sideways. 3 big resistances held and the bear trend line is intact. Bears are heavily favored to continue down and I expect a third leg. Can the third leg get much below 16400? I don’t know but I doubt it. Only a deep recession would get us there and for that we would need earnings going real bad. Below 18000 I expect 17200 to be the next big support but a retest of 16400/16500 could happen.
Invalidation is above 19388.
short term: Neutral. Sideways most likely until a clear breakout above or below. Below 18000 we could do 17500 or 17000 fast. Above 19388 market is free to test much higher again.
medium-long term - Update from 2024-04-20: My most bearish target for 2025 was 17500ish, given in my year-end special. We had the clear W1 and W3 but now it’s messy.
Only a big tariff agreement news can move the markets and that can go either way. You have no edge in guessing what will happen, so having huge swing positions right now does not make much sense. If earnings go bad, we will go much lower. What is the next big support to be hit? The lows of 2022 at 12565. Can we really get there? With a deep recession and some bigger failings, sure but for now it’s unrealistic to expect it.

In this short video, I break down the daily chart of the Micro EIn this short video, I break down the daily chart of the Micro E-mini Nasdaq 100 (MNQ, June 2025 contract) and share my outlook for the upcoming week. I'm watching the weekly high and low, a potential bearish retracement pattern, and price behavior around the 0.5–0.75 Fibonacci levels.
📉 My main scenario is a short-term move higher into resistance, followed by a potential continuation to the downside – but I'm staying flexible and watching price action closely.

E-mini Nasdaq 100 Weekly Overview & Outlook for next weekIntroduction of Gap Quadrants. Weekly Orderflow Review. Expecting classic Weekly "Power of Three" next week. Along with a SMT Divergence on the lows with ES1!

My market read of Micro E Mini NASDAQThis is my market reading of NASDAQ on MIcro E mini contract and thge big boy TF is 1 hour and 15 min is the trading TF.

Nasdaq (NQM) - Best Time To Buy Nasdaq?After a successful run from September 2022, making more than 110% up to the beginning stages of 2025, Nasdaq has successfully made holders over the past few years richer than those who decided to invest in a random meme coin and what we have been seeing over the past months is a decline close to 30% which is miniscule in the grand scheme of the bull trend.
Could the market continue to trade lower? Possibly but if you learn the skills necessary to hedge your portfolio by shorting the market, its a win win scenario!

my learning ICTSMC tradingThis is how I am learning ICTSMC trading. It has different charts with different indicators. Some of these indicators are hidden since they are paid versions. This is a plain ICT way of looking at charts.

NQ daily 20ma is following the top of bull flag. I'm not saying I know what is gonna happen in NQ. Especially with all the stuff happening in the gov right now. I do see that something big is gonna happen though. Wait for the bull flag on the 4 and 1 hr to break in either direction. Either we will make another low or fly up. Don't guess!! Just react. It'll probably move on some crazy news but in reality the charts don't lie.

MNQ!/NQ1! Day Trade Plan for 04/17/2025MNQ!/NQ1! Day Trade Plan for 04/17/2025
📈18594 18670 18740
📉18440 18365 18290
Thanks to all my followers! Truly appreciate the support!
Please like and share for more NQ levels Tues & Thurs 🤓📈📉🎯💰
*These levels are derived from comprehensive backtesting and research and a quantitative system demonstrating high accuracy. This statistical foundation suggests that price movements are likely to exceed initial estimates.*

Perfect Range Clear Tradable Levels To Watch!Sometimes you just have to zoom out and look at which levels will produce the highest probability trade. if those levels do not get reached, then we should not trade them.
Lets see if price gets to these levels tomorrow and if so we know how to position ourselves.
Calculate Your Risk/Reward so you don't lose more than 1% of your account per trade.
Every day the charts provide new information. You have to adjust or get REKT.
Love it or hate it, hit that thumbs up and share your thoughts below!
This is not financial advice. This is for educational purposes only.

NQ: 173rd trading session - recapOverall good session in terms of movement and "price clarity", however I was completely distracted. That is one of the worst things that can happen to one trading. This is what I mean when I say I perform bad: Not locked in & not excited.
Man you know why you were distracted, f*ck that, cmon. At least for 45min a day.

Nasdaq - $2,000+ In 30 Mins Utilising Fair Value Gaps17/4/25 - Same strategy, different day guys!
It would be a lie if I told you it was a easy day today because it wasn't!
After a few small losses, I managed to take some meat off the bone with net profits totalling over $2,000 within the space of 30 mins.

NQ Range (04-17-25)NAZ with some major help from the final 30 minute (Close) and Overnight as we see the 500 point retracement. Next play is with the extended weekend and the lift may continue. Big bounce (U turn) off KL 18,300 or Danger Zone, the lift comes when? The final minutes and O/N. Holiday volume next, Long may be the play should the Pump/Dump not show up or the NAZ can stay above KL 18,715.
IDS view below.

NASDAQ - pull back and short continuationBased on volume and last price move I suppose that price is in a pull back until area 18800.
In this area we can find the seller ready to a new push down.
Only if price break the resistence we can have a new long.


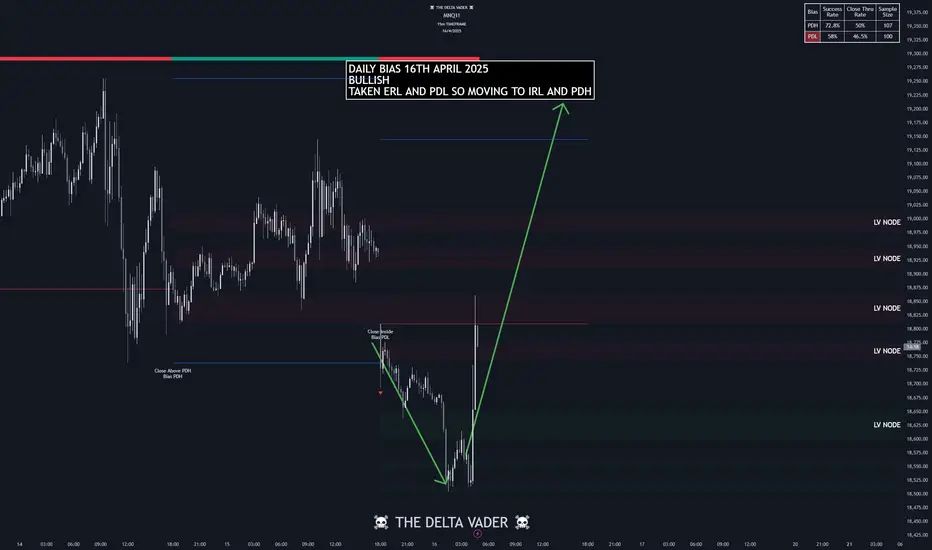
NQ KEY ICT LEVELS - 17th APRIL 2025Levels marked on the chart using my free indicator which marks out all of the ICT key levels which can be used for potential POIs where price might react

NQ KEY LEVELS - 17th APRIL 2025Key levels marked by using low volume nodes for potential key levels where we may see price react.

NQ: 172nd trading session - recapYea, it's a bit unfortunate that that happened but it is what it is, don't really care. But what is good is that price action actually starts looking "good" again as explained on the chart. Maybe the highly volatile days are now over, man they were brutal.
I'm just sitting on my hands right now waiting for that one bullish day, which will hopefully be reflected directly in the opening, I could catch a massive move to the upside.
Until then, I expect price to just chop around for a bit, could be tilted to the upside or downside, don't really know & don't really care. If price action is good and "foreseeable" I can make good decisions.

NQ! Short Idea (MMXM, Quarterly Theory) LONDON REVERSALHello everyone, today you will see my current Short Idea on the Nasdaq. I want to see the reaction of the 15M OB that we are sitting in, if we show Disrespect of that Area, I will be looking for Shorts.
Praise be to God
-T-

NQ UpdateLooks like the EOD pump might be a setup for the ECB meeting tomorrow morning. Did not play it because my indicators did not hit oversold. Taking the patient approach and just waiting for a good play.
I did get into sold gold though this morning. They way they're pumping gold, the dollar index won't matter as much, lol.

NQ Short (04-16-25)Staying with the Short, NAZ with a Gap up and a Gap down move in the off session (very little in the Reg). When the moves in the markets seem manufactured and happen in the O/N or off session, look Short. Looks like 18,400-300 is the Danger Zone here and below could be the express way lower. Should we get there, look Long 1st as the will U Turn it away (Gap, off session, Holiday, Dead Zone or any low volume period).

Nasdaq - $1,000 In 12 Mins Utilising The Opening Range High probability strategy after 9:30 opening bell where you can make a decent sum of money trading the 1-min timeframe in under 1-hour!