RTY Daily Support Shows it is holdingThe RTY Daily time frame is in a down channel. The
market hit the bottom of the channel and found
support. The market is now pushing bullish towards
the top of the channel price point 1936.2 about
+803 ticks above the market. It will be a good
idea to turn to the one hour time frame and to
look for long ideas in the buy zone.
RTY1! trade ideas

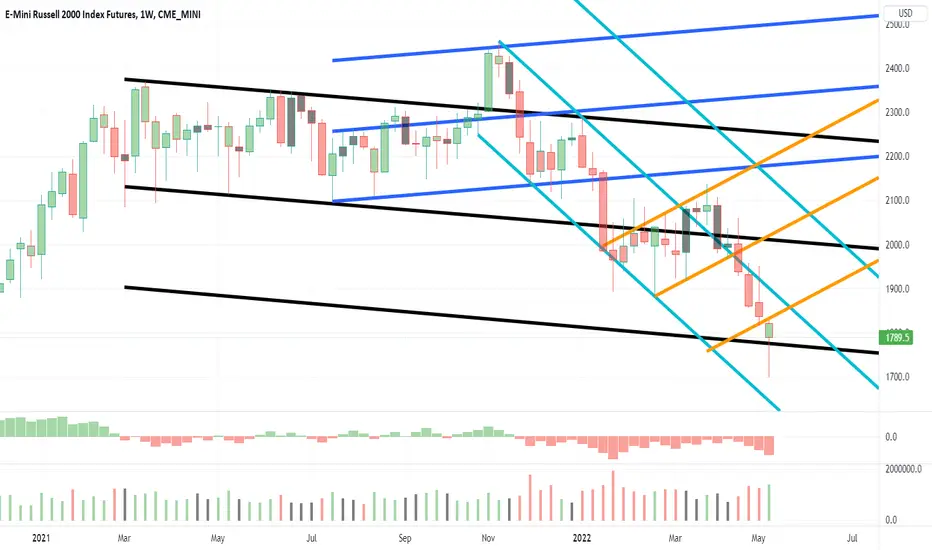
RTY1! - Weekly Market Update, 5/23/22Russell 2000 has settled practically right on the key BLACK support structure I mentioned last week.
I do not see a setup to execute at this time based on current support and resistance structures.
If anything should change, I'll gladly issue a midweek update...
Wishing you a blessed and profitable week ahead!

Recession? Then Why is the RTY Outperforming?Usually a slowing in the economy hurts the growth oriented RTY the most. Instead, it is outperforming.

Russell Testing Pivotal ResistanceIn this update we review the recent price action in the Russell2000 futures contract and identify the next high probability trading opportunities and price objectives to target

A long-overdue small-cap reboundThe small-cap Russell 2000 Index has been the underdog among the four major US indices since last year. Its post-pandemic rally halted in early 2021, and subsequently, it went sideways for more than a year without making new highs. Meanwhile, the tech darlings continued to go north all the way until the beginning of this year.
The first half of 2022 has been marked by widespread risk-off sentiment and a precipitous drop in the US equity market. After being down almost 30% from the high, we now find the Russell 2000 Index at significant technical support levels that we believe a meaningful rebound will likely ensue.
The Index has bounced right at the 50% Fibonacci retracement level near 1700. We also observed bullish RSI Divergence where price made lower lows, but RSI showed higher lows, suggesting the bearish momentum is waning and at the cusp of a reversal.
Entry at 1806, stop above 1680. Targets are 1880 and 2100.
Disclaimer:
The contents in this idea are intended for information purposes only and do not constitute investment recommendations or advice. Nor are they used to promote any specific products or services. They serve as an integral part of a case study to demonstrate fundamental concepts in risk management under given market scenarios.

RTY - JunkCo IndexIndependent Producers remain in implosion mode.
Bankrupt Companies feigning existence worthy of a Bid.
Chasers will be wrecked again 1610 fails and it's going
to lose 90%+ into 2023 October.
______________________________________________
For now - the Flamingo is having a bit of difficulty getting
gamblers back to the tables.
A complete horror show... this JUNK.

RTY1! - Weekly Market Update, 5/16/22Nasdaq futures like the other major indexes have tested their BLACK channel monthly support structure and have at least based on this past Friday's action bounced slightly. Even if this downtrend continues, there's likely to be some relief at this point. If this past Friday was all of the relief or not, that's yet to be seen. I do not see any actionable ideas offered at this point in time on this particular index. Stay calm, disciplined and consistent - those who do will prevail. Wishing you a blessed and profitable week!
RTY down Fib hitThe RTY daily time frame is in a down channel.
The market is at the bottom of the channel where
support could be found. If support is found, the
market could push bullish towards the top of the
channel price point 1944.1. If support fails. The
market is expected to push bearish towards the
daily down Fibonacci price point 1700.6 about
-869 ticks below the market. It will be a good
idea to wait for either A) the market to close
below the bottom of the support then turn to
the one hour time frame to look for short ideas
towards the daily down Fibonacci
or B) Support holds and the market creates a
bullish trend and pushes bullish towards the top
of the channel price point 1936.2 about +1,482
ticks above the market.

Believe it or Not, The RUT 2000 has Hit Major Support.The rut2000 has finally achieved the downside objective. Because of that, I am leaning long RUT stocks.

RTY DailyOversold on RSI and MFI, and it hit my target line which is the price level pre-COVID
Old resistance is new support so I expect a bounce around here, some garbage stocks are green already today

Russel M2K: short to $1769 first area of supportFollowing the fibonacci ladder of decent, $1769 is the next area of support. If not a sharp bounce or cuts through fib 8, fib 13 at $1358 is next support level.
Upside resistance $2047(unlikely), $1965, and $1883


RTY1!5.9.22 RTY1!: The Russell is moving lower to where I would expect to find buyers, and gave a review about how I find the range boxes, and how I try to manage my charts.

FUTURE Russel 2000 M2K still short MK2 Still Down But opportunity to short on Pull back
See here Bigger picture (D left ) showing last contraction Zone
where as small picture (30m right ) offer Likely Pullback
and potential SHORT OPPORTUNITY
Short From FibFan 0,618% (Cyan Colored) on the graph

Russell Trading The Wedge BreakIn this update we review the recent price action in the Russell2000 futures contract and identify the next high probability trading strategy and price objectives to target

RTY - MegaphoneZero Bound.
An Insurance Company with Annuities @ 5% cannot exist at net negative Returns.
They go out of business.
RTY is DOA in time.

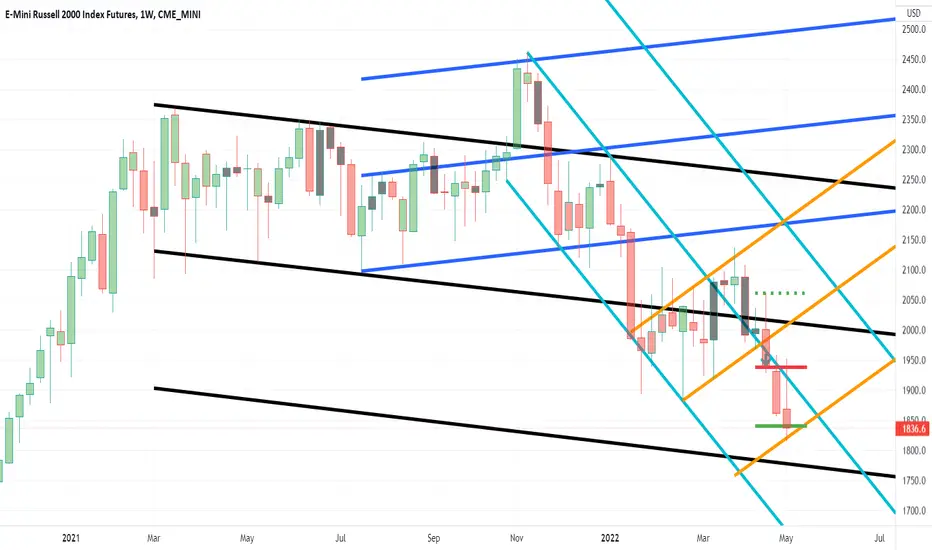
RTY1! - Weekly Market Update, 5/9/22The Russell 2000 has completed its targeted objective.
At this time there's no viable opportunity to trade this index.
I've adjusted support and resistance structures for your reference.
Wishing you a blessed and profitable week!
Elliott Wave View: Russell 2000 (RTY) Turning Lower post FOMCShort Term Elliott Wave View in Russell 2000 (RTY) suggests the decline from March 29, 2022 high is unfolding as a zigzag Elliott Wave structure. Down from March 29 peak, wave 1 ended at 1966.6 and rally in wave 2 ended at 2060.90. Index then resumes lower in wave 3 towards 1903.50 and rally in wave 4 ended at 1957.60. Final leg lower wave 5 ended at 1834.50 which ended wave (A).
Wave (B) rally is proposed complete at 1951.85. However, the Index still needs to break below ave (A) at 1834.50 to validate this view. Internal of wave (B) unfolded as a zigzag in lesser degree. Up from wave (A), wave A ended at 1908.20, pullback in wave B ended at 1867.80 and wave C higher ended at 1951.85. This completed wave (B) in higher degree. Index has turned lower in wave (C). Near term, expect wave 1 to end soon, then Index should rally in wave 2 to correct the decline from wave (B) before it resumes lower. As far as pivot at 1951.85 high stays intact in the first degree, expect rally to fail in the sequence of 3, 7, or 11 swing for further downside.


Russell2000 Trading The Wedge PatternIn this update we review the recent price action in the Russell2000 futures contract and identify the next high probability trading pattern. and price objectives to target

RTY1! - Weekly Market Update, 5/2/22The Russell 2000 confirmed resistance by testing the TEAL channel on Friday. I expect support below to likely be tested this upcoming week.

FOMC Party is over folks!End of the relief rally after FOMC. Lots of shorts squeeze for the big expiry today. We should see a sharp pullback now.
We hit multiple resistances on Russel 2000 on multiple hourly, daily and weekly chart. Current price : 2050, Target is back to 1900. SL 2110
Disclaimer : I have short positions in Russel 2000 as mentioned here. This is not an investment advice but an educational idea.

RTY UpdateGarbage stocks tanking again, and the daily indicators are not oversold yet so there is definitely a possibility that small caps break support here. Not sure what the pattern will look like though.
I expect money losing companies with no growth to continue getting hammered on earnings.
