Gold | Short Bias | Liquidity Sweep Potential | (April 2025)Gold (XAUUSD) | Short Bias | Liquidity Sweep Potential + Structure Watch | (April 27, 2025)
1️⃣ Insight Summary:
Gold is at a critical level where multiple scenarios could unfold. Money flow and structure suggest a higher probability for lower prices, but a move higher toward $3,477 remains possible too.
2️⃣ Trade Parameters:
Bias: Short
Entry Zone: Watching for liquidity sweep around $3,225
Stop Loss: Above recent structure highs if the sweep setup fails
TP1: Partial profit near $3,225 (liquidity grab area)
TP2: Further downside depending on momentum and structure after the sweep
3️⃣ Key Notes:
✅ Money flow is exiting, and market structure leans toward lower prices for now.
✅ Heavy liquidity is resting around $3,225 — a sweep could trigger key reactions and partial exits.
✅ Still some possibility that Gold pushes higher toward $3,477 if market sentiment flips short-term bullish.
✅ Structure is not completely clean yet — waiting for a clearer setup before going heavy.
✅ Watch S&P 500 closely: a short-term correction there could help Gold move higher temporarily as a non-correlated asset.
❌ Risk if Gold breaks higher before sweeping $3,225, invalidating the current short-biased setup.
4️⃣ Follow-up:
I will continue monitoring Gold’s structure closely and will update the idea if we get a clean sweep or confirmation for the next move.
Please LIKE 👍, FOLLOW ✅, SHARE 🙌 and COMMENT ✍ if you enjoy this idea! Also share your ideas and charts in the comments section below! This is best way to keep it relevant, support us, keep the content here free and allow the idea to reach as many people as possible.
Disclaimer: This is not financial advice. Always conduct your own research. This content may include enhancements made using AI.
1OZ1! trade ideas

Gold Futures – Short-Term Technical Outlook as of April 23Gold surged to nearly $3,500, but multiple indicators now point to a potential top. A short-term correction or consolidation phase appears likely before any new highs.
Bearish Signals Across the Board:
RSI Divergence: RSI failed to confirm recent highs, showing bearish divergence.
Momentum Fading: MACD & momentum oscillators rolled over → rally exhaustion.
Volume Shift: Rising on down moves, drying up on rallies → classic distribution.
Bearish Candlesticks: Spinning tops + bearish engulfing patterns signal reversal risk.
Elliott Wave: Likely completed 5-wave impulse → next up: ABC correction?
Cycles: April top aligns with intermediate cycle peak → watch May for cycle low.
Seasonality: Historically weak May–June period approaching.
COT Data: Speculators still long, but commercials heavily short → caution warranted.
🎯 Trade Setups
Short-Term (1–5 Days)
🎯 Short Entry: ~$3,400
📉 Target: $3,270 → $3,215
🛑 Stop: Above $3,460
Medium-Term (1–4 Weeks)
📉 Short below $3,215 → Target $2,970
✅ Or go long on confirmed bounce at $3,150–$3,180
Long-Term (1–6 Months)
🟢 Bullish bias after correction completes
🛒 Buy zones: $2,960–$2,720
🎯 Targets: $3,540 → $3,900+
⛔ Stop: Below $2,700
🧭 Outlook Summary:
Bias: Cautiously Bearish (short-term) → Bullish (long-term)
Gold likely topped in April — expect weakness or sideways action before the next major leg higher. Be patient for a better buying opportunity later this spring/summer.

gold 3265 long, stop of 3230, profit of 4.6% at 3416When gold reaches 3265, I open a long position with a stop of 3230, a profit of 4.6% at 3416


Gold will continue to break out!Looking for the bullish price action to continue as we get ready to close the week and next week close the month. Watching for support as we move into the killzones. Excess has been created on the DOM and it should continue from here.

Gold correctionPrice movement started upward from blue arrow mark. It can tesr mercilessly test black line drawn level.


Now that we Have our Pullback...Back to BULLISHNESSBeen waiting on this pull back. Now that we got it price should move more reasonably. Looking for the bullish action to continue and new highs to be made.

The Gold Rush is overA rejection off of 3508 level with an evening star or shooting star (depending on how you view candlestick patterns) and a close below other key Fibonacci and sup/res levels will likely cause a downtrend in the foreseeable future. Any closes below key levels should be viewed as bearish price action.

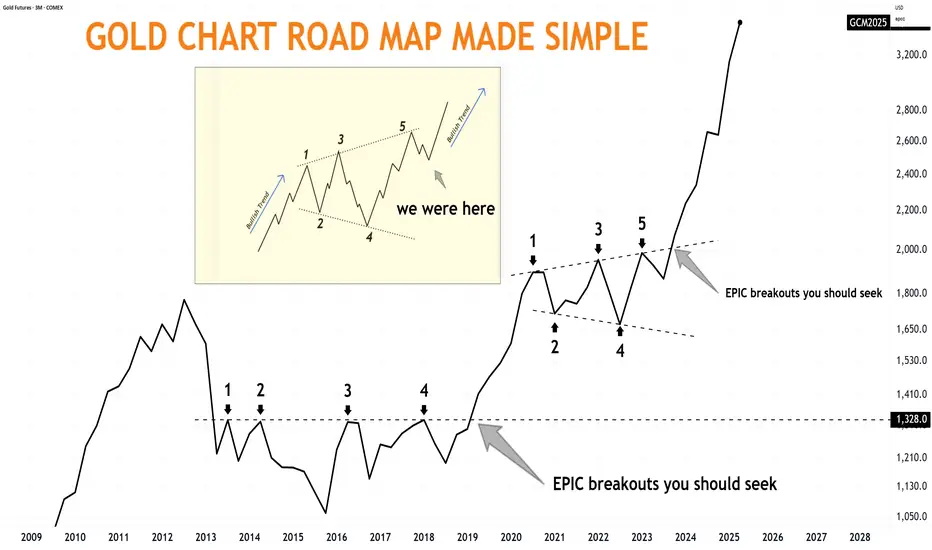
Gold is up over $1500Since I did this post back in August 2023.
Gold is up over $1500 in less than 2 years.
EPIC breakouts you should seek
Gold 97350 trend finally caughtWe are happy we could get the trend of gold finally. As we had posted yesterday though gold moved higher to 99358 intraday lost its gain 2000 and finally closed below the resistance 98582 we had mentioned.
Today we expect Gold close would be below 98073 and more possibility to get corrected to test the imbalance at 90910.
------------------------------------------------------------------------------------------------------------------
yesterday we posted in
Our analysis about gold was going wrong and wrong again and it is moving higher and higher.
After careful study and applying *new TA concepts * we have come to a conclusion it would be 98582 which would be its climax resistance on close basis and would get corrected.

Long trade
15min TF overview
Trade Overview: GC1! (Gold Futures) Long Position
Entry Price: 3468.9
Profit Target: 3509.6 (+1.17%)
Stop Loss: 3462.2 (–0.19%)
Risk-Reward Ratio: 6.07
Target Liquidity High: 3509.8
🕔 Entry Time: 5:05 AM
📅 Date: Tuesday, 22nd April 2025
🌍 Session: London AM
⏱ Entry Timeframe: 5-Minute TF
Trade Reasoning
Intraday Market Structure:
The 5-minute timeframe revealed a bullish internal break of structure, signalling a short-term reversal and favouring buy-side continuation. Price had formed a higher low, respecting bullish structure and suggesting accumulation.


GOLD LONGGold is bullish, creating hidden divergence on lower time frames, im waiting for return to OTE levels to buy.

GOLD LONG IDEA for next week - targeting growth**Direction:** **LONG**
**LONG Targets:**
- **T1 = $3280**
- **T2 = $3320**
**Stop Levels:**
- **S1 = $3220**
- **S2 = $3190**
**Wisdom of Professional Traders:**
This analysis synthesizes insights from thousands of professional traders and market experts, leveraging collective intelligence to identify high-probability trade setups. The wisdom of crowds principle suggests that aggregated market perspectives from experienced professionals often outperform individual forecasts, reducing cognitive biases and highlighting consensus opportunities in Gold.
**Key Insights:**
Gold has continued as a refuge for capital amidst macroeconomic uncertainties, maintaining a strong bullish momentum due to increasing inflationary pressures and global geopolitical tensions. Market experts suggest the Federal Reserve's dovish monetary tone may further fuel demand for Gold, coupled with a weakening US dollar that enhances attractive price levels. The recent trend shows heightened levels of institutional buying, signaling potential for upward movement. Favorable seasonality and demand during market risk cycles enhance its appeal.
Recent supply dynamics, driven by mining constraints and costly extraction levels, contribute to a limited Gold supply market scenario. With central bank reserves gradually accumulating Gold to hedge risks, we anticipate robust demand levels supporting prices. Analysts highlight that hedge funds and sovereign wealth funds show extreme interest towards additional Gold allocation—advising LONG strategies with focus...

MGC Short Setup15 min is developing a hidden divergence. If we get that divergence to confirm, and price reaches OTE level before target is hit im looking to short. Other confluences are supply zones within that area as well as higher timeframe order blocks to add on to resistance.

Gold: Will 3,260 Flip From Supply to Springboard?Micro Gold Futures — 30 min chart
BULLISH ABOVE 3,260 | BEARISH BELOW
🗺️ Structure in Focus
Macro bias (4 h/1 D): remains bearish — lower highs & lows since late‑April.
Intraday context: price climbing in a rising channel; buyers defend each channel low since 1 May.
Grey zone 3 255‑3 260:
• 61 %‑78 % Fib retrace of the last leg down
• Breakdown base now acting as supply
• Mid‑channel + intraday VWAP overhead
A decisive H1 close above 3 260 plus a bullish retest flips the bias long toward ≈ 3 280.
🧭 Trade Map
🔴 Base‑case short
• Trigger – bearish reaction inside / below 3 255‑60
• Targets – 3 230, then 3 210 (-27 % Fib extension)
• Invalidation – H1/H4 close > 3 260
🟢 Flip‑bull plan
• Trigger – H1 close above 3 260 and zone holds as support
• Target – 3 280 supply (channel top + prior S/R)
• Invalidation – H1 close back under 3 250
(Risk ≤ 1 % per idea; scale out at interim levels.)
📊 Narrative to Watch
Fed speakers & US data could jolt real yields and gold flow.
Asia session often sets the tone—watch Shanghai physical premium chatter.
Softening DXY gives the upside‑break thesis a tail‑wind.
What’s your play—fade the zone or ride the breakout? Smash the boost 🔥 and follow for live updates!
Not financial advice; just sharing my plan.
Tags: #Gold #XAUUSD #Futures #PriceAction #Fib #TechnicalAnalysis

GOLDM ANALYSISTechnical view on Goldm(mcx).
Disclaimer: This does not construe to be an investment advice. Investments/trading are subject to market risks.
All information is a point of view, and is for educational and informational use only.
The author accepts no liability for
any interpretation of articles or comments on this platform being
used for actual investments.

GOLD Weekly Outlook 1st week of May 2025 COMEX:GC1!
Expecting another displacement towards the downside on Gold on a weekly fractal. Perfectly lined up with daily and weekly internals

MGCMGC is not that clear yet. Waiting to see what London session brings to the table. Will be watching it on NY session.

Gold in correction or long consolidation phaseGold has a pattern of about 74% run. You could break it down to 74/3 as well as I had done in a related post. It could ender into some consolidation for a few months

Gold evaluation using Trend Fib extension...dual peaksAs you can see from the lower picture...I took two retrace peaks and traced the move with the fib tool and made the smaller one the solid line and the farther one the dashed line...
Kinda fits pretty neatly in those lines eh??
Not much more to say, make up what you think the move action will be, I just provide the lines...
And the numeration for those lines to be calculated is based off Pi and Fib percentages...so its not an actual default setting...can go into my other ideas where I actually give a table of all the numbers to enter in to achieve said result you see above and below...
Both Trend Fibs are with the reverse setting on...
-------
10 min
-------
1 day far
------
This Trend is with the reverse setting off: weekly overview:
and the closer daily...notice that 2000 quad peak:
and yet closer view...see that bottom line under the sideways consolidation is like almost the same as previous...:
finally the 10 min close up:
everything but the two arrows is the same from above...so you get a nice overall price consolidation with these lines...

Gann Box stacking and Gold...funny things alignNot much to explain here...just the boxes all aligned and stacked up onto each other starting from the 1999 low to the bull run high of 2011, and then copied and stacked to show current price action.
However, there is a weird thing with boxes of the Gann type. Usually 25 and 75 time allotments, or 1st and last boxes, are the most aggressive moves. But this one has already almost broken the box in the first panel of the 25%.
So you will either have a stagnation and then slight down or up drift until you hit the later 75% box at the most right....or you just go "nah, Irish goodbye to yah lad" and jump to the next box up...we shall see.
But those lines do hold some weight and you can see the Gann angles had a few good pivots and one generally good line to follow through this initial explosion up.
But we go sidesways if the house of bird poo color can clean up their act...pull a Styx and "Come sail away with me..." to the next box up and run to the like 5K limit, who shall know....
--------
from 1999 summer to 2011 summer to move the height of the box....
and its been achieved in merely 2 some years as of this point...oh boy
VVVV Notice the 3 peaks at 1900 perfectly aligning with that box edge before the next box is stacked up to accommodate current price action...
Your thoughts...right...wrong...or just a :) all welcome
PS...These boxes arent made to fit this chart...It is just a pivot low to pivot high and then copied and stacked/extended....But see how that 2nd box times the triple peak and explosion into the newest up move...crazy hmm
