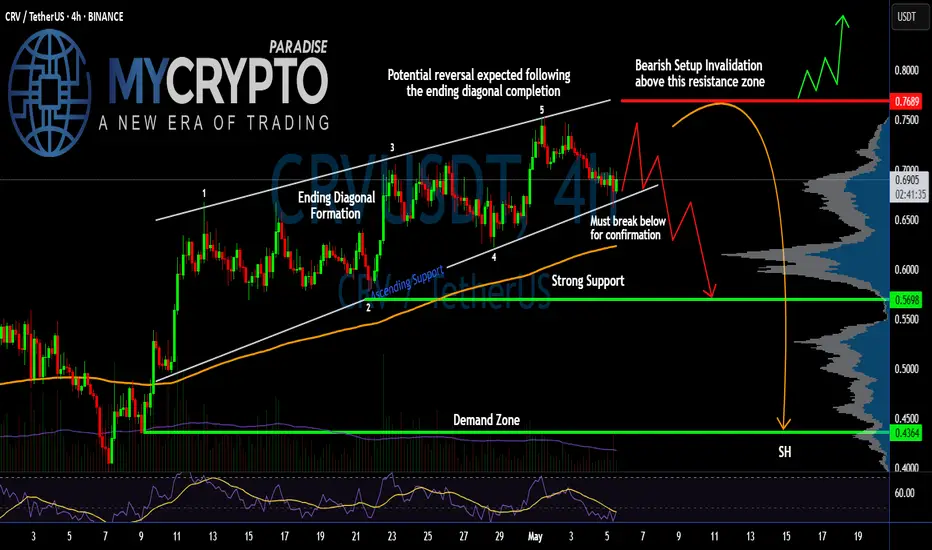
Is #CRV Ready for a Reversal or Not? Key Levels to Watch Yello Paradisers! Are we about to witness another brutal trap as #CRV finishes its final leg up and prepares to flush all late longs? Let’s break down the setup for #CurveDAOToken:
💎#CRVUSDT is currently trading around $0.6948, and what we’re seeing here is a classic Ending Diagonal Formation, a pa
CRV Breakout Retest – Eyes on the Next Leg UpLSE:CRV has been trading within a well-defined ascending channel, showing a consistent bullish structure. Recently, the price broke above a key horizontal resistance level and is now retesting it—this is a classic breakout-retest scenario.
As long as CRV holds this support and remains within the c

CRVUSDT Weekly Analysis – Major Trend Shift Unfolding!!Curve DAO Token (CRV):
Market Structure Overview
Uptrend Phase (2021 – mid-2022):
CRV was in a healthy bullish structure, printing consecutive Higher Highs (HH) and Higher Lows (HL). Momentum was strong and sentiment bullish.
Downtrend Phase (mid-2022 – end of 2024):
Price flipped structure and

CRV is Getting Ready For a Skyrocket Move (1D)CRV has formed a Cup & Handle pattern — a well-known structure that typically signals a bullish reversal.
From a broader technical perspective, there's additional confluence suggesting a potential trend shift.
If the most recent dip holds, it may confirm that CRV has completed its bearish cycle an

CRV 1H Chart SetupThis chart features CRV on a 1-hour timeframe with a 50-period SMA, RSI(14), and trend lines. Created for technical analysis and personal reference. Shared for transferring to another account.


CRV/USDT – 2W Chart Overview
The price is currently consolidating after a prolonged downtrend and shows signs of a potential trend reversal.
The price has broken out of a falling wedge (bullish pattern).
Currently testing the Fibonacci retracement levels — most notably the 0.5 - 0.618 zone, which may act as a pullback entry

CRV SWING LONG TRADE IDEACRVUSDT has done bullish BOS after Turning its trend into bullish (CHoCH). Box is a trap where we can see smaller pump but real swing entry zone is in FVG area, keep eye on that.

Curve (CRV)Crv usdt Daily analysis
Time frame 4hours
Risk rewards ratio >2.5 👈👌
Target = 0.8$
Moving up and down in the uptrend tunnel

CRV/USDT LONGCRV/USDT has successfully broken out of a falling wedge, signaling a potential bullish trend. To confirm the breakout before entering a trade, an ideal long entry would be a retest of the breakout level around $0.45 - $0.48. Alternatively, if the price maintains above $0.50, a breakout continuation

See all ideas
Summarizing what the indicators are suggesting.
Oscillators
Neutral
SellBuy
Strong sellStrong buy
Strong sellSellNeutralBuyStrong buy
Oscillators
Neutral
SellBuy
Strong sellStrong buy
Strong sellSellNeutralBuyStrong buy
Summary
Neutral
SellBuy
Strong sellStrong buy
Strong sellSellNeutralBuyStrong buy
Summary
Neutral
SellBuy
Strong sellStrong buy
Strong sellSellNeutralBuyStrong buy
Summary
Neutral
SellBuy
Strong sellStrong buy
Strong sellSellNeutralBuyStrong buy
Moving Averages
Neutral
SellBuy
Strong sellStrong buy
Strong sellSellNeutralBuyStrong buy
Moving Averages
Neutral
SellBuy
Strong sellStrong buy
Strong sellSellNeutralBuyStrong buy
Displays a symbol's price movements over previous years to identify recurring trends.