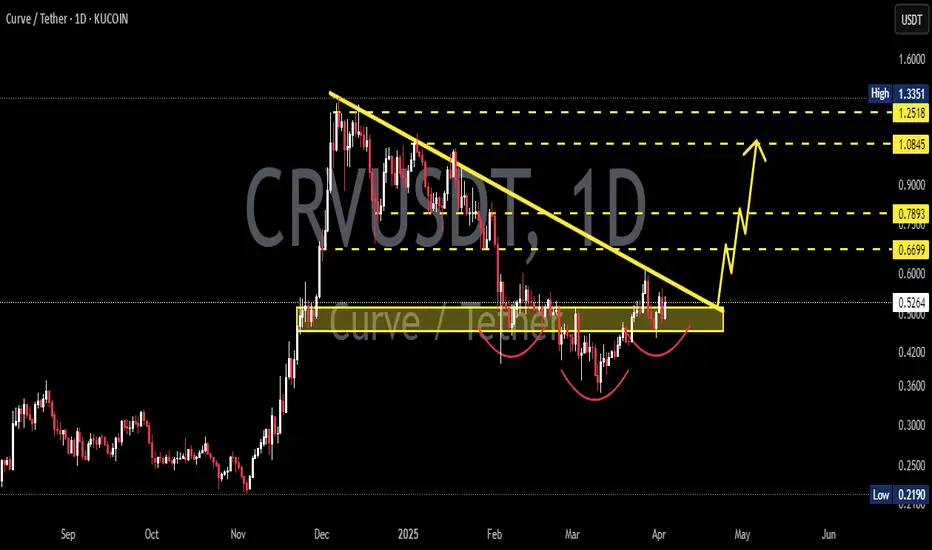
CRV is Getting Ready For a Skyrocket Move (1D)CRV has formed a Cup & Handle pattern — a well-known structure that typically signals a bullish reversal.
From a broader technical perspective, there's additional confluence suggesting a potential trend shift.
If the most recent dip holds, it may confirm that CRV has completed its bearish cycle and has now entered a new five-wave bullish structure. Based on the current price action, it's likely that wave 3 is unfolding at the moment.
Interestingly, the depth of the Cup & Handle formation aligns well with typical wave 5 targets, offering additional validation for this setup.
In this scenario, the wave 3 target sits around $0.78, which also coincides with a previously untapped order block — adding further credibility to the level.
For a longer-term outlook, wave 5 could extend above the $1.00 mark, depending on market conditions and overall momentum.
Moreover, the Ichimoku Cloud is currently reflecting a bullish bias, with price action moving above the cloud and supportive Tenkan-Kijun alignment — reinforcing the overall bullish outlook.
Achieving this target may take time — but as we all know, in crypto, time often behaves differently.
— Thanks for reading.
CRVUSDT.P trade ideas

CRV/USDTKey Level Zone: 0.605-0.615
HMT v8 detected. The setup looks promising, supported by a previous upward/downward trend with increasing volume and momentum, presenting an excellent reward-to-risk opportunity.
HMT (High Momentum Trending):
HMT is based on trend, momentum, volume, and market structure across multiple timeframes. It highlights setups with strong potential for upward movement and higher rewards.
Whenever I spot a signal for my own trading, I’ll share it. Please note that conducting a comprehensive analysis on a single timeframe chart can be quite challenging and sometimes confusing. I appreciate your understanding of the effort involved.
Important Note :
Role of Key Levels:
- These zones are critical for analyzing price trends. If the key level zone holds, the price may continue trending in the expected direction. However, momentum may increase or decrease based on subsequent patterns.
- Breakouts: If the key level zone breaks, it signals a stop-out. For reversal traders, this presents an opportunity to consider switching direction, as the price often retests these zones, which may act as strong support-turned-resistance (or vice versa).
My Trading Rules
Risk Management
- Maximum risk per trade: 2.5%.
- Leverage: 5x.
Exit Strategy
Profit-Taking:
- Sell at least 70% on the 3rd wave up (LTF Wave 5).
- Typically, sell 50% during a high-volume spike.
- Adjust stop-loss to breakeven once the trade achieves a 1.5:1 reward-to-risk ratio.
- If the market shows signs of losing momentum or divergence, ill will exit at breakeven.
The market is highly dynamic and constantly changing. HMT signals and target profit (TP) levels are based on the current price and movement, but market conditions can shift instantly, so it is crucial to remain adaptable and follow the market's movement.
If you find this signal/analysis meaningful, kindly like and share it.
Thank you for your support~
Sharing this with love!
HMT v2.0:
- Major update to the Momentum indicator
- Reduced false signals from inaccurate momentum detection
- New screener with improved accuracy and fewer signals
HMT v3.0:
- Added liquidity factor to enhance trend continuation
- Improved potential for momentum-based plays
- Increased winning probability by reducing entries during peaks
HMT v3.1:
- Enhanced entry confirmation for improved reward-to-risk ratios
HMT v4.0:
- Incorporated buying and selling pressure in lower timeframes to enhance the probability of trending moves while optimizing entry timing and scaling
HMT v4.1:
- Enhanced take-profit (TP) target by incorporating market structure analysis
HMT v5 :
Date: 23/01/2025
- Refined wave analysis for trending conditions
- Incorporated lower timeframe (LTF) momentum to strengthen trend reliability
- Re-aligned and re-balanced entry conditions for improved accuracy
HMT v6 :
Date : 15/02/2025
- Integrated strong accumulation activity into in-depth wave analysis
HMT v7 :
Date : 20/03/2025
- Refined wave analysis along with accumulation and market sentiment
HMT v8 :
Date : 16/04/2025
- Fully restructured strategy logic

CRVUSDTCRV ~ 1D Analysis
#CRV Buy after successfully penetrating this resistant line with a short -term target of at least 10%+.


CRV ANALYSIS (1D)The smaller structure of CRV is bearish. It is expected to reject downward from the red zone, with our rebuy zone being the green area.
Given that the internal structure is bearish, it is ultimately expected to reach the green zone.
Closing a daily candle below the invalidation level will invalidate this analysis.
For risk management, please don't forget stop loss and capital management
When we reach the first target, save some profit and then change the stop to entry
Comment if you have any questions
Thank You
I am short CRVUSDT here..CRVUSDT I think over extended to the upside here with the caveat that BTC is not pumping right now. If it does, it totally invalidates this short. But I think we are at a long standing downward trendline. If it respect this point and gets rejected you can see we may grab a 2.5:1 RRR trade with a SL just outside the swing high on the 27th of March.
I have fractionally small limit short order of which one has filled spread between 0.54-0.5799 as I think if we go higher we only wick up. SL at 0.6198
Enjoy!

CRV Lets Short Full LeverageCRV cant break current major resist and created wick in the top
also we see final EW so short full leverage is legit here

CRVUSDTWe can attempt to buy CRVUSDT from specified level as it make HL , also there is no bearish divergence occur indicate that it moves upward.
SL , TP mention in chart.

CRV/USDT: BUYHello dear friends
Due to the good price growth
Now we can buy in stages with capital and risk management and move towards the specified goals.
*Trade safely with us*

CRVUSDT 1DCRV ~ 1D Analysis
#CRV Buy after successfully penetrating this resistant line with a short -term target of at least 10%+.
CRV: Close above 0.60 and its on like donkey kong My brothers in stablecoin finance:
It is now, for the first time in its history in public markets: the time for CRV to win.
Stablecoin wars of the 2020's rage on and now commence.... Contro-Founder liquidated fully carried out on stretcher
Big winners for me, but not advice. I manage my own risk and ive got my hands full

Curve DAO - crvCurve is a DeFi ecosystem consisting of several core products:
Curve DEX is a decentralized exchange best suited for stablecoins and pegged assets that uses an automated market maker (AMM) to manage liquidity.
crvUSD decentralized stablecoin issuance app allows you to borrow stablecoin against secure assets such as ETH and BTC with collateral liquidation protection.

CRV SHORTCrypto Introduction
Curve is a decentralized exchange liquidity pool on Ethereum designed for extremely efficient stablecoin trading. Launched in January 2020, Curve allows users to trade between stablecoins with low slippage, low fee algorithm designed specifically for stablecoins and earning fees. Behind the scenes, the tokens held by liquidity pools are also supplied to the Compound protocol or iearn.finance where to generate more income for liquidity providers.
Short retest of range breakdown. (if given)

i am bullish on CRV Based on my analysis, CRV is on an uptrend, and I think it will hit the below targets.
Near Targets :
- .52 $
- .56 $
- .59 $
LongTerm :
- .7 $
- .84 $
- 1 $
This is not financial advice; it is just what I am going to do for myself.

CRV SHORT SETUP ALL trading ideas have entry point + stop loss + take profit + Risk level.
hello Traders, here is the full analysis for this pair, let me know in the comment section below if you have any questions, the entry will be taken only if all rules of the strategies will be satisfied. I suggest you keep this pair on your watchlist and see if the rules of your strategy are satisfied. Please also refer to the Important Risk Notice linked below.
Disclaimer

CRV.DAILY.22.3.2025🚨 CRV.DAILY.22.3.2025
💹 Buy Spot Signal: Scalping
🎯 Target: 30%, around $0.55
📈 Entry: Around $0.43
⏳ Hold Time: A few days
Good luck! ✨

CRV/USDTHello friends
Due to the heavy price drop, buyers have been supporting the price well on the indicated support, which has caused a good price growth.
Now in the indicated support areas, you can buy in steps with capital management.
If you want to be with us in the Alt Season, send us a message.
*Trade safely with us*

CRV Trade Setup: Potential Relief RallyWith seller exhaustion appearing across multiple projects, CRV could be positioning for a relief rally. If the market structure shifts bullish—forming a higher high and successfully retesting support—we may see a move into upside liquidity zones.
🛠 Trade Details:
Entry: Around $0.46 (Support Level)
Take Profit Targets:
$0.57 (First TP - Initial Resistance)
$0.67 (Second TP - Mid Liquidity Zone)
$0.77 (Third TP - Strong Resistance Area)
Stop Loss: Daily close below $0.39
Watching for bullish confirmation before entry. 🚀


CRV Potentially looking at how CRV may go into an accumulation cycle before and uptrend. Ideally I will look for my executions and average in if we begin to form a range down here over a prolonged period of time. Once the range is established I would look to accumulate the tail side of the range.
I have a few levels I would prefer not to be hit. They can be but if they are I could see us having a lengthy accumulation range before any uptrend forms.

#CRV/USDT Analysis📉 LSE:CRV formed Equal Lows on the Daily TF!
🚀 Looking good here—needs to reclaim PWH $0.55 to turn bullish.
✅ Adding some #CRVUSDT in spot as well!

CRVUSDT Potential for a Bullish Revers? ( EW Analysis )CRVUSDT, a popular cryptocurrency trading pair, is showing potential signs of a bullish reversal based on Elliott Wave Theory. This analysis aims to break down the current wave structure and outline possible future price movements.
Wave Structure Overview
The chart follows a complex corrective wave pattern, which consists of WXYXZ labeling. This pattern indicates an extended correction phase that may be coming to an end. Below is a breakdown of the observed waves:
1. Wave (iii): This wave marked a strong uptrend, indicating significant bullish momentum in the past.
2. Wave WXYXZ Correction: The corrective structure suggests a prolonged retracement, leading to potential price exhaustion at the recent low near $0.40.
3. Wave (iv) and Completion of Wave Z: The labeling shows that wave (iv) is completing, forming a potential higher low on the support trendline.
4. Formation of ABCDE Structure: A possible contracting triangle (ABCDE) is forming within the final leg of wave Z, signaling an imminent breakout.
Key Support and Resistance Levels
- Support: The ascending trendline near $0.44 - $0.48 serves as a critical level for price stabilization.
- Resistance: The downward trendline resistance around $0.55 - $0.60 is the first hurdle for bullish continuation.
- Target Zone: If wave (v) initiates, potential targets lie between $1.20 - $1.50, aligning with the upper channel.
Bullish Outlook and Confirmation
To confirm the bullish scenario, CRVUSDT must break above the $0.55 resistance with strong volume. A successful breakout would validate the start of an impulsive wave (v), pushing prices higher.
Risk Factors
- A breakdown below the $0.40 invalidation level would negate this bullish outlook and extend the correction.
- Market sentiment and external factors such as Bitcoin’s price action and macroeconomic conditions may impact the projected wave structure.
Conclusion
CRVUSDT appears to be at a pivotal moment, with Elliott Wave analysis suggesting a potential bullish reversal. Traders should monitor key levels and look for breakout confirmations before making any trading decisions. If the projected wave (v) unfolds, we could see a significant rally in the upcoming sessions.
Disclaimer: This analysis is for educational purposes only and should not be considered financial advice. Always conduct your own research before making any investment decisions.

CRVUSDT on path for 2$We have a huge trend shift (Bearish to Bullish) in weekly scale and I expect it to reach 1$ and then 2$. 0.5$ is a fair price to buy and hold.
