CRVUSDTWe have a bunch of ranges here. Global 0.53-1.6, and few locals: previous 0.53-0.744 and current 0.86-1.06. I expect it could be a manipulation with 0.86 level and under it there is our first support zone at around 0.82. The next support at the high of previous range at 0.74-0.76 and the large one at 0.65-0.7 and the last at 0.58.
CRVUSDT.P trade ideas

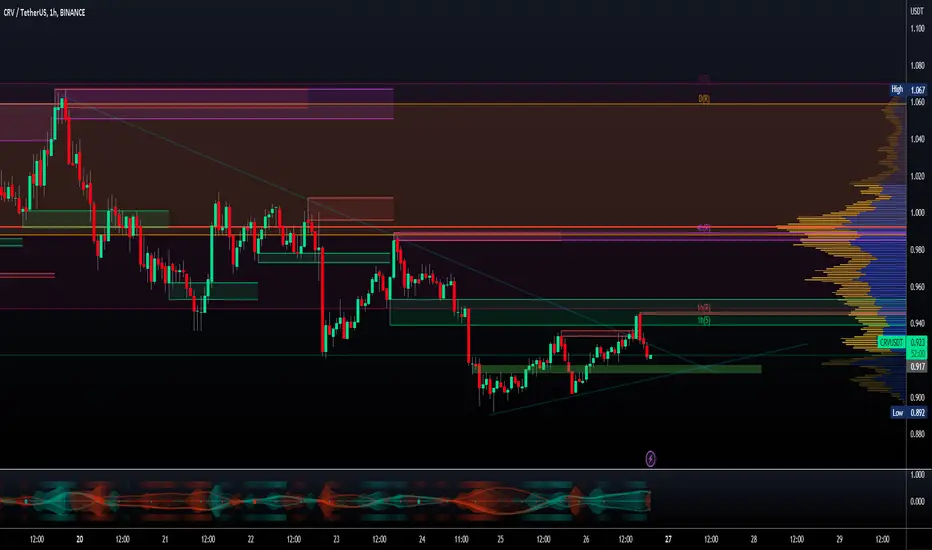
CRV/USDT - Curve: Resistance_Breakout◳◱ A Resistance Breakout has been identified on the $CRV / $USDT chart. The price has broken above a key resistance level, indicating a potential bullish trend. The next resistance key levels are located at 1.103 | 1.187 | 1.392, and the major support zones can be found at 0.898 | 0.777 | 0.572. Consider entering at the current price zone of 0.923 and targeting higher levels.
◰◲ General info :
▣ Name: Curve
▣ Rank: 61
▣ Exchanges: Binance, Kucoin, Bybit, Huobipro, Gateio, Poloniex
▣ Category/Sector: Financial - Decentralized Exchanges
▣ Overview: Curve Finance is a decentralized exchange optimized for low slippage swaps between stablecoins or similar assets that peg to the same value (e.g. wBTC/renBTC). The protocol employs a Automated Market Maker that was built specifically to give DeFi users low slippage and liquidity providers steady fee revenue.
◰◲ Technical Metrics :
▣ Mrkt Price: 0.923 ₮
▣ 24HVol: 5,480,605.876 ₮
▣ 24H Chng: -0.859%
▣ 7-Days Chng: -9.50%
▣ 1-Month Chng: -7.32%
▣ 3-Months Chng: 72.61%
◲◰ Pivot Points - Levels :
◥ Resistance: 1.103 | 1.187 | 1.392
◢ Support: 0.898 | 0.777 | 0.572
◱◳ Indicators recommendation :
▣ Oscillators: NEUTRAL
▣ Moving Averages: STRONG_SELL
◰◲ Technical Indicators Summary : SELL
◲◰ Sharpe Ratios :
▣ Last 30D: -1.81
▣ Last 90D: 2.63
▣ Last 1-Y: -0.09
▣ Last 3-Y: 0.23
◲◰ Volatility :
▣ Last 30D: 0.96
▣ Last 90D: 1.05
▣ Last 1-Y: 1.31
▣ Last 3-Y: 1.85
◳◰ Market Sentiment Index :
▣ News sentiment score is N/A
▣ Twitter sentiment score is 0.49 - Bearish
▣ Reddit sentiment score is 0.71 - Bullish
▣ In-depth CRVUSDT technical analysis on Tradingview TA page
▣ What do you think of this analysis? Share your insights and let's discuss in the comments below. Your like, follow and support would be greatly appreciated!
◲ Disclaimer
Please note that the information and publications provided are for informational purposes only and should not be construed as financial, investment, trading, or any other type of advice or recommendation. We encourage you to conduct your own research and consult with a qualified professional before making any financial decisions. The use of the information provided is solely at your own risk.
▣ Welcome to the home of charting big: TradingView
Benefit from a ton of financial analysis features, instruments and data. Have a look around, and if you do choose to go with an upgraded plan, you'll get up to $30.
Discover it here - affiliate link -
#crv #Crypto # #signal4 hours time frame to identify divergence in RSI.
15 min time frame to identify break out of the FTR zone.

#CRVUSDT 4H Chart
After breaking below the previous low at $0.936, price gave us bearish confirmation from this 4h supply zone where it is currently getting rejected from. MACD is showing bearish weakness, RSI and EMAs are neutral. Price may liquidate the equal highs present above this 4h supply zone before moving down again but overall i am expecting price to keep moving down and liquidate this support line.

CRVUSDTHi Traders, the price has been forming a rising wedge which is a bullish pattern but we can see a bearish divergence in the recent high. We have to wait for confirmation for a short trade, entry shall be taken if the last higher low gets broken as marked on the chart. TPs and SL are mentioned on the chart.

#CRVUSDT 4H Chart
Price dropped and broke below the support line as well as the previous low at $0.936 leaving a valid 4h supply around $0.99. MACD is bearish, RSI is sold and EMAs are neutral. Price should retrace and tap into this supply zone before moving down again aiming to liquidate the support line.

CRVUSDT likely to head down to weekly supportThe price is hitting daily resistance and I would expect that it will be pushed back to the weekly support again. I believe, a short is favorable here.

Crv usdtIn this situation, the way to climb is always...
the price target to reach 1.14
Stop : red line

Crvusdt | Expecting Bullish Move Crvusdt
CRV is very bullish for the next few weeks
Resistance Trendline successfully broken & retested.
Note : Always Trade With Your Own Research & Manage Risk Properly

CRV is still bullishHi, dear traders. how are you ? Today we have a viewpoint to BUY/LONG the CRV symbol.
For risk management, please don't forget stop loss and capital management
When we reach the first target, save some profit and then change the stop to entry
Comment if you have any questions
Thank You

CRVUSDT hitting daily support, bounce is likelyt o next resistPrice was rejected by daily resistance zone DR2 and now it has fell back to the daily support region DS1. It is likely that the price will bounce here and head for the next resistance zone.

Curve 31623Curve stablecoin is on the way soon. Will we see CRV shred back up to the old ath?
Banking crisis. Trust in fiat is beginning to crumble.
Hold your own assets
Bitcoin
Gold/Silver
Cash-some always
Hard assets
Chickens

CRVUSDT hit resistance, likely to puysh back for a whileThe price has hit the 4h resistance zone 4HR1. I would expect that the price will retrace from here a bit towards and max to the next 4h support area 4HS1.

CRVUSDTCRVUSDT
What is Broadening Triangle?
While forming, it is difficult to predict the actual breakout from the pattern because of the diverging nature.
More over the tendency and requirement of surpassing the previous highs in the formation of the pattern, is a reason why breakout traders face a lot of stoploss triggers , trapping bulls when the previous peak is breached and bears when the previous low is breached and then the price turns back and returns into the pattern.
The direction in which the final breakout will occur is also very difficult to predict in the Broadening Triangle pattern.
In the charts below, let us take some real -life examples of the broadening triangle.
LONG
ENTRE:
0.817
TP1 :
0.97 20%
TP2 :
1.4 70%
TP3 :
1.7 100%
SL :
0.735 -10%

Potential buy area for CRV if you want to go long This could be a potential buy rea for CRV if you want to go long

CRVUSDT heading up to next daily reisstance around 0.95-0.96The price broke the previous daily support and now trading inside the next daily support. The price is likely to head for the next daily resistance DR1 as marked on the chart. A probable upward move path has been depicted on the chart in sequence of steps L1, S2 and L3. Lets how the price action develops but the target is the daily resistance zone around 0.95-0.96 at first.

CRVUSDT (4H) - Bearish breakoutHi Traders
CRVUSDT (4H Timeframe)
The market is in a downtrend, and we are waiting for an entry signal to go SHORT below the 0.883 support level. Only the upward break of 1.003 would cancel the bearish scenario.
Trade details
Entry: 0.883
Stop loss: 1.003
Take profit 1: 0.814
Take profit 2: 0.697
Score: 8
Strategy: Bearish breakout


Follow up post: $CRV will rise again this yearIn my last post, you could have caught CRV at $1 and rode it up to $1.30
I think there's an even better Risk/Reward ratio at this level, though if BTC loses 20,000, perhaps not worth holding onto it until better market conditions emerge.
I'd like to long at ~0.888, or enter with a low leverage long here at .92 back up to $1

CRVAt this Time that BTC usdt range .btc.d go up it is good time to open short positon for coin that will be down with pair BTC

CRV USDT BEARIH Trend starts in 1 HR TFBINANCE:CRVUSDT In the 1 Hr TF, we see the bearish Trend starting. The bearish engulfing candle that is good sign down side.

CRVUSDT to head for next 4h resistance zone around 1.036CRVUSDT is ready to go to the next 4h resistance zone 4HR1. The price is likely to aim at least for 1.036 level.
