Impulsive Wave 3 About To Start, Big Move Is Coming 📈 At Daily Timeframe We Had a Strong Bullish Move From 0.22$ And I Named It As a Wave 1, Currently The Price Playing At The Wave 2 And In My Idea Wave C From 2 Completed At The 0.73$ Also Double Bottom Formed At That Area, Expect a Breakout From The Trend Line And Start a Wave 3 Toward a 1.2$ And 1.71$
CRVUSDT.P trade ideas

CRVUSDT - keep an eye on itCRV one on the most bullish coins in every bullish wave.
Daily chart shows a consolidation of symmetrical triangle pattern.
It gives positive sign as it breaks 0.5 fib , 50ema ... But still need more confirmation for being bullish
Valid to buy now
Ur target is 2$ at least in case of breakout the symmetrical triangle pattern
Best regards Ceciliones 🎯

CRV Inverse Head & Shoulders Textbook formation of inverse H&S pattern on CRV.
BTC rally as we head to trump inauguration will provide enough fuel to boost the price to $1.3 area. This will be the left shoulder breakout .

CRV price projection Great things, great minds,
The charts are speaking, and the story is one of patience and preparation. CRV has spent 952 days in accumulation, a period where the strong hands quietly load up while the market sleeps. This is the foundation of a potential explosive move, and we may just be on the brink of something special.
The recent breakout from the accumulation zone is marked by an SOS (Sign of Strength), a classic signal in the Wyckoff method that suggests the bulls are taking control. The retest of the breakout zone around $1.19 is crucial, and it's showing signs of holding—a positive sign for what’s to come.
With the chart suggesting a potential move toward $7.32, this could mean a 532% upside from current levels if the stars align. But remember, my friends, this is not financial advice—this is preparation, not prediction. The market does what it does, and our role is to stay informed and adapt.
Levels to Watch:
Support: $0.197 (strong base).
Key Breakout Zone: $1.19 (testing as support).
Target: $7.32 (long-term potential).
We’ve waited long, and the patient often get rewarded. The trend will reveal itself soon. Keep your eyes on the charts, your strategy sharp, and emotions in check. Let’s see where this journey takes us.
Stay wise and stay ready,
Lord MEDZ

$CRV Daily Bottom confirmedPretty simple stuff here. Deviation into manipulation zone and printing a B/R reversal signal with each consecutive day closing above the upper wick. Do not need to over think this here.

CRV CRV is in a Long position, at least i think that after analyzed all timeframes to 1D there is possibility that crv it will retest last ATH.
NFA
DYOR

Keep eyes on CRV! So after breaking a bullflag pattern and hitting 2 take profits I am looking for another Long-term entry before BINANCE:CRVUSDT goes to the moon. What I like to see is hitting 0.70 area and hold above it. 0.70 is minor support which is active in 1D timeframe. I would love to see hit 0.50 area too. Either way I will enter long position.

CRV LongAs we analyze the CRV/USDT pair, we observe two possible scenarios for price movement in the coming days.
Bullish Scenario (Red Path):
Price breaks above the current resistance levels, moving towards the PMH (Previous Monthly High). This scenario indicates a strong upward rally, aiming to reach our conservative target in the near term. Watch for confirmation of buying pressure in the short-term to validate this path.
Bullish Scenario 2 (Black Path):
Price may fail to break the current resistance, resulting in a pullback towards the PML (Previous Market Low), which could act as support. If the price fails to maintain above this level, further downside is possible, but it might provide an opportunity for a bounce in the future.
Ensure to monitor the key price levels (current support and resistance) for a clear confirmation of the chosen path.
Happy trading!

CRV Long : Inverse Head & ShouldersLooking at the 4HR chart price has found support at the 78% fib level, higher than the low at 0.67. The shape formed is clearly an inverse head and shoulders pattern. That dip might have been a shake off for overleveraged buyers and the real long begins from here.
BTC has also maintained above 90K.
The first check point should be around the 23% fib level at the 1.25 resistance zone. fter this a fall back to 0.9 before attacking $3

CRV LongPrice has completed final wave down in short term consolidation hovering above 0.8 supply zone.
Looks like a potential reversal long to the 0.95 fair value gap. Momentum indicators on higher time frames are also bullish and seem to agree.

CRV is looking good for a short term dip and runCRV is looking good for a short term dip in alignment with BTC price action. I will be accumulating CRV on dips as the HTF charts point to larger price appreciation potential.
My first target after the dip is 1.42 and 2.81 and my banana zone target is $10.

CRV bullish scenarioCRV price has retraced 50% of the last push up since Nov.
price has confluence with the midpoint of a local descending channel, and a much larger ascending channel.
Possible for a long if price shows reaction on lower timeframes.
Chart shows 2 options but need confirmation on lower timeframes.
A possible entry could be a scalp entry with stop just below the 0.5 fib mark.

buy positionHello guys
This currency has managed to break its resistance due to its good growth.
Now, when the Pullback moves, it goes under the Pullback with a stop loss and enters a long position.
Capital management should be observed.
This analysis is only reviewed from a technical point of view.
Be successful and profitable.

Prepare to BUY Spot CRVUSDT on the New D1 Cycle
🌟 Position Yourself for the Next Move with CRVUSDT! 🌟
🌍 Market Overview:
CRVUSDT is setting up for a strong bullish cycle on the D1 timeframe, making it an excellent opportunity to achieve a significant short-term gain.
📊 Trade Plan:
📌 Entry: Around $0.944 – An optimal entry point for the new cycle.
🎯 Target: x1 (100% gain) – Doubling your investment with a well-defined target.
⏳ Hold Time: 1 week – Strategic short-term hold aligned with the D1 cycle.
🔍 Strategy Insights:
My custom tool RainBow MG3 highlights CRVUSDT as a high-potential setup for this cycle.
Volume trends and technical indicators suggest a strong chance of reaching the target within the specified timeframe.
🚀 Next Steps:
💬 Contact me for personalized guidance or more detailed strategies.
💡 Note: This is not financial advice. Always DYOR before trading.
🔥 CRVUSDT is ready for a breakout – Position yourself and ride the wave! 🔥

CRV - Clear BreakoutFollowing on from the last idea, we can see the follow through and breakout on CRV
The first target is the prior highs near 1.3, then alt season likely kicks off in full steam with the Trump inauguration in 3 weeks.
Could the inauguration be a sell the news event? Maybe - We'll have to assess the price action closer to the time.
The reality is that R/R is skewed positively right now for CRV
- Daily MACD cross-over
- RSI MA Crossover and now moving up
- Resistance breakout on a Bull flag pattern.

CRV Long : Inverse H & S PatternInverse head an shoulders pattern spotted on CRV 1 hr chart .
Left shoulder bottom coincides with strong demand zone between 0.82 and 0.88.
Primed for explosive upward move to 1.9 resistance

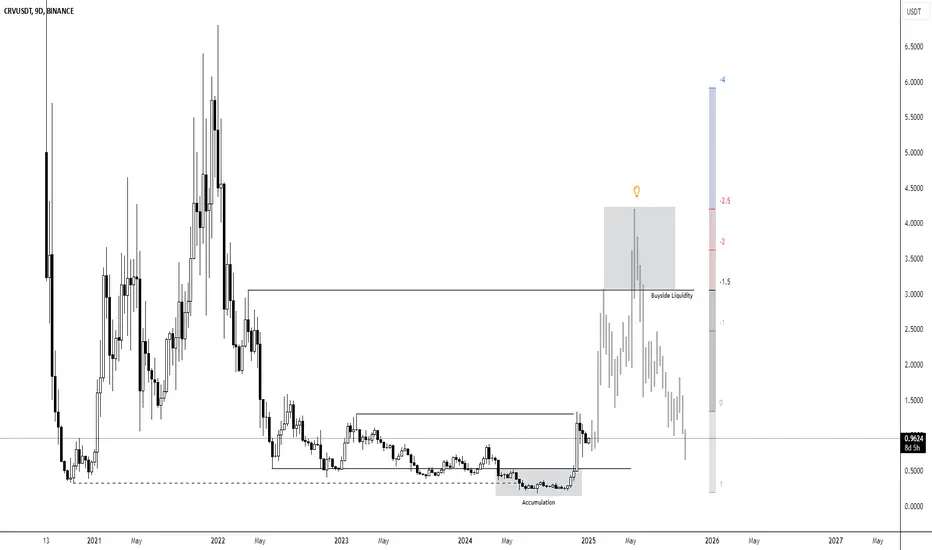
CRV LongThis chart displays the price movement of CRV/USDT on a 9-day candlestick chart.
The chart illustrates a significant accumulation phase followed by a sharp price rise, with an emphasis on the liquidity levels at key points.
The initial drop in price leads into a period of consolidation, marked by an "Accumulation" phase.
After the accumulation phase, we observe a surge in price, targeting the "Buyside Liquidity" area.
The price is currently at a lower level, indicating potential opportunities or challenges in the price movement based on liquidity zones.
The liquidity zones, particularly the "Buyside Liquidity" marked on the chart, could play an important role in price dynamics moving forward.
The chart suggests that future price movements may depend heavily on the dynamics of the liquidity zones and the market's ability to maintain higher price levels after the recent surge.
TradeCityPro | CRV: Daily & 4H Correction Patterns👋 Welcome to TradeCityPro!
In this analysis, I will examine the CRV coin, which belongs to the Curve project, a DEX platform in the DeFi space. The analysis is conducted on both daily and 4-hour timeframes.
📅 Daily Timeframe: Beginning of Correction In this timeframe, after negative news for CRV, the price reached the support level at $0.2309, forming its main bottom there and starting its upward movement after accumulating.
📊 With the influx of buying volume, resistances at $0.3425 and $0.4070 were easily broken, and the price reached the resistance at $1.2630 with high momentum. The buying volume peaked and, with a Blowoff candle, the price correction began.
✨ The RSI exiting the Overbuy zone triggered the start of the price correction down to $0.382. Currently, the bottom of the correction is forming at $0.7890, and breaking this area could reach the $0.5 and $0.618 Fibonacci levels, which I have marked as limited areas for you. If these areas break, the next supports will be at $0.4070 and $0.3425.
🔍 If the price wants to continue in the same cycle with the next upward wave, it should not lose the range between $0.5 to $0.618 Fibonacci. Breaking this range would reset the market momentum, and the chart would need to create a new structure.
📈 For going long, the best trigger is breaking $1.2630 targeting $1.9116. If this area breaks, the volume and RSI should converge with the price. A divergence in volume greatly increases the likelihood of a fake break. For riskier triggers, it's better to look into the 4-hour timeframe.
⏳ 4-Hour Timeframe: New Price Structure in the Correction Phase
In the 4-hour timeframe, we can see the last upward leg in more detail and apply a new Fibonacci Retracement.
🧩 Currently, the price has corrected to the $0.5 Fibonacci zone, which overlaps with $0.7890, forming the primary bottom of the correction.
🔼 For an early and risky long position, breaking the resistance at $1.0451 is suitable. However, as mentioned in the daily timeframe analysis, the main resistance and trigger for going long is $1.2630.
🔽 For a short position, breaking the $0.382 Fibonacci, which overlaps with $0.9069, is suitable, but be cautious as you are shorting in a correction of an upward trend. Engage minimal risk so that if the upward trend continues, you do not incur significant losses.
🔑 The market volume has been decreasing since the peak at $1.2630 and is now at its lowest. The RSI is also ranging between 39.82 to 59.27, with a break of either area potentially introducing new momentum into the market.
📉 If further correction occurs, the next supports are the $0.618 Fibonacci at $0.69, and the areas at $0.5553 and $0.4661.
📝 Final Thoughts
This analysis reflects our opinions and is not financial advice.
Share your thoughts in the comments, and don’t forget to share this analysis with your friends! ❤️

CRVUSDT Accumulation Phase for Long RunAfter manipulation major Lows and Swept Liquidity and recent price action I anticipate have a Run to higher levels.
IT'S NOT A FINANCIAL ADVICE.

CRV Long- It has hit our HTF Sellside Liquidity Target and an all time low.
- Market is in fear mode right now
- Bitcoin dumping
- CRV Stops have been ran.
- We are trading below the Monthly opening which is great for buying if we are bullish

CRV - Ready for the next leg higherBINANCE:CRVUSDT Stalled at horizontal resistance. Indicators cooled off, and now ready for the next leg higher.

CRV Long Mad volume on CRV right now. After revisiting demand zone between 0.618 and 0.5 fib levels bulls have taken over with no visible resistance in sight.

Analysis of CRV/USDT Market DynamicsThis analysis centers around the CRV/USDT trading pair. By comprehensively considering multiple factors such as historical price movements, trading volume changes, technical indicators and the macro market environment, it delves deeply into the underlying logic of price trend formation, dissects the driving forces behind the volatility, and attempts to discover the potential investment opportunities therein. The aim is to provide cryptocurrency traders and investors with a comprehensive and in-depth interpretation of the CRV/USDT market and a reference for decision-making
