LOLC LOLC Daily
This chart and analysis are not financial advice. Do your own research before trading or investing.
LOLC.N0000 trade ideas

LOLC.N0000Death cross is now appearing daily chart. Closely monitor the GAP indicated in chart and fib levels as well.
Disclaimer: The information and analysis provided in this publication are for educational purposes only and should not be construed as financial advice or recommendations to buy, sell, or hold any securities. The author and TradingView are not responsible for any investment decisions made based on the content presented herein. Always consult a financial professional before making any investment decisions.

L O L C HOLDINGS PLCCSELK:LOLC.N0000
This chart and analysis are not financial advice. Do your own research before trading or investing.
On the weekly chart, LOLC stock finds support within the Fibonacci golden pocket. Notably, the convergence and break of MA 10, 50, 200, and TL resistance could strongly influence upcoming price movements.
Conversely, the daily chart witnesses the 10 DMA break, albeit with insufficient volume. Immediate support lies in the 370-395 range. On the upside, the 50 DMA and TL resistance pose challenges.
Daily RSI portrays upward movement as it finds support from the TL support. Monitoring these technical factors is key.

HAYL to LOLC Group - LOLC Still undervalued compared to Jan 22LOLC Still undervalued compared to Jan 22. If CSE bull run persists more potential on it. not a buy or sell recomendation

LOLC.N - L O L C HOLDINGS PLCCSELK:LOLC.N0000
Disclaimer: This chart and analysis are not meant to be, and do not constitute, financial, investment, trading, or other types of advice or recommendations. Do your own due diligence before trading or investing in any stock exchanges, Indices, Stocks, Forex, Crypto etc.
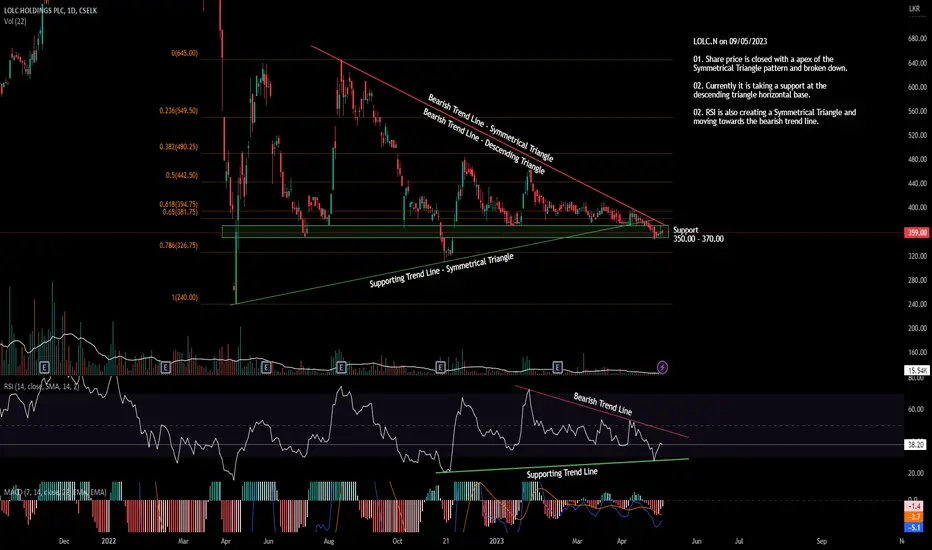
LOLC.N on 09/05/2023
01. Share price is closed with a apex of the Symmetrical Triangle pattern and broken down.
02. Currently it is taking a support at the descending triangle horizontal base.
02. RSI is also creating a Symmetrical Triangle and moving towards the bearish trend line.
LOLC.N - L O L C HOLDINGS PLCCSELK:LOLC.N0000
Disclaimer: This chart and analysis are not meant to be, and do not constitute, financial, investment, trading, or other types of advice or recommendations. Do your own due diligence before trading or investing in any stock exchanges, Indices, Stocks, Forex, Crypto etc.
LOLC.N on 08/05/2023
01. Share price is closing with a apex of the Symmetrical Triangle pattern.
02. RSI is also creating a Symmetrical Triangle and moving towards the bearish trend line.

LOLC | AnalysisAnalysis: The stock is currently forming an expanding triangle pattern, but it has not yet closed above the 30-day moving average. In order to become bullish, it will need to break above the 410 level.
Stop-Loss: 379
Disclaimer: This chart and analysis are not meant to be, and do not constitute, financial, investment, trading, or other types of advice or recommendations. Do your own due diligence before trading or investing in this stock.

LOL SeeCounter everyone laughing up on and beaten down is now trying to find support around 380-400 zone. Prices are below moving average ribbon, being consolidated within a symmetrical triangle. If the given trendline resistance broken, counter might complete an inverse HNS pattern, and likely to break up!

LOLCA close above Ascending triangle at 410 will indicate a bullish continuation in the short-term while taking the price towards the resistance level of the Symmetrical triangle pattern. A close below the Ascending Trendline may indicate a bearish reversal.
Disclaimer: Please conduct your own research before making any investment decisions and note that this is not investment advice.
