CVXUSDT | Long | DeFi Optimizer | (May 2025)CVXUSDT | Long | DeFi Optimizer Bounce with Growing Spot Demand | (May 2025)
1️⃣ Quick Insight:
CVX has caught my attention again—been watching it from the early days and now it’s starting to show strength, both on spot and futures. Current structure and sentiment are looking solid for a potential

$CVX | 1D long BINANCE:CVXUSDT is testing the top of its local range and supply zone.
A prime A+ spot setup could form on a healthy pullback. 🔥
Watching closely for a higher low to confirm continuation.
🎯 Base scenario:
— Breakout and retest of the range top inside a supply area.
— Looking for a pullback into

#CVX/USDT#CVX
The price is moving within a descending channel on the 1-hour frame, adhering well to it, and is heading for a strong breakout and retest.
We are seeing a bounce from the lower boundary of the descending channel, which is support at 2.98.
We have a downtrend on the RSI indicator that is about

#CVX/USDT#CVX
The price is moving within a descending channel on the 1-hour frame and is expected to break and continue upward.
We have a trend to stabilize above the 100 moving average once again.
We have a downtrend on the RSI indicator that supports the upward move with a breakout.
We have a support a

CVXUSDT | Critical Resistance Zones – Precision Trading Required🚨 High-Importance Levels Identified – Stay Ahead of the Crowd
The red box and red line represent key resistance zones where sellers are likely to be aggressive. Blindly longing into resistance is how most traders lose money, but we trade with precision and confirmations.
🔴 Short Scenario (Rejectio

CVXUSDT 1WCVX ~ 1W Analysis
#CVX Buy gradually from here if you still have a Conviction on this coin with a short -term target of at least 20%+.

CVX/USDT – Is the scenario repeating? Continuing to work.The previous trading idea has played out with 3 out of 4 marked zones reached.
We saw a false breakout from the descending channel, followed by a pullback in line with the overall market—returning to the channel’s support zone.
I’ve noticed a potential formation of either a diamond pattern or an e
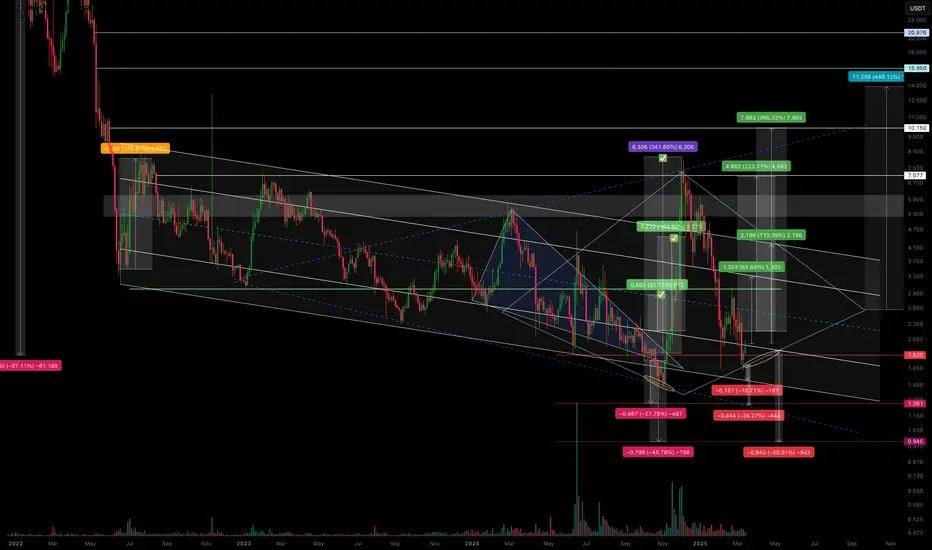
If it receives support at 2.179-2.862, it is time to buy
Hello, traders.
If you "Follow", you can always get new information quickly.
Please also click "Boost".
Have a nice day today.
-------------------------------------
(CVXUSDT 1D chart)
The key is whether it can receive support near 2.835-2.862 and rise above 3.267.
Since the StochRSI indicator

CVXUSDT SHORTWe wait for confirmation on the chart, and after confirmation, we can enter a short position.
Again, this is my personal opinion, and risk management should not be forgotten.
Don’t forget the boost! 🚀

#CVX/USDT Ready to launch upwards#CVX
The price is moving in a descending channel on the 1-hour frame and is adhering to it well and is heading to break it strongly upwards
We have a bounce from the lower limit of the descending channel, this support is at a price of 2.85
We have a downtrend on the RSI indicator that is about to

See all ideas
Summarizing what the indicators are suggesting.
Oscillators
Neutral
SellBuy
Strong sellStrong buy
Strong sellSellNeutralBuyStrong buy
Oscillators
Neutral
SellBuy
Strong sellStrong buy
Strong sellSellNeutralBuyStrong buy
Summary
Neutral
SellBuy
Strong sellStrong buy
Strong sellSellNeutralBuyStrong buy
Summary
Neutral
SellBuy
Strong sellStrong buy
Strong sellSellNeutralBuyStrong buy
Summary
Neutral
SellBuy
Strong sellStrong buy
Strong sellSellNeutralBuyStrong buy
Moving Averages
Neutral
SellBuy
Strong sellStrong buy
Strong sellSellNeutralBuyStrong buy
Moving Averages
Neutral
SellBuy
Strong sellStrong buy
Strong sellSellNeutralBuyStrong buy
Displays a symbol's price movements over previous years to identify recurring trends.