HiMonacci Strike | Long | CYBERUSDT | 3m🔹 Signal Type: HiMonacci Strike
🔹 Direction: LONG
🔹 Symbol: CYBERUSDT.P (BINANCE)
🔹 Timeframe: 3m
🔹 Entry Price: AT LEAST 0.96 (lower is okay in case of drawdown)
🔹 Close Price: 0.981
🔹 Leverage: 4.97x (Calculated based on liquidation at 0.778)
💥 RISK MANAGEMENT NOTE:
THIS SYSTEM DOES NOT USE STOPL

#CYBER/USDT#CYBER
The price is moving within a descending channel on the 1-hour frame, adhering well to it, and is heading for a strong breakout and retest.
We are seeing a bounce from the lower boundary of the descending channel, which is support at 1.46.
We have a downtrend on the RSI indicator that is abo

CYBERUSDT 1DCYBER ~ 1D Analysis
#CYBER High risk trading. Buy after successfully penetrating this resistant line with a short -term target of at least 10+.

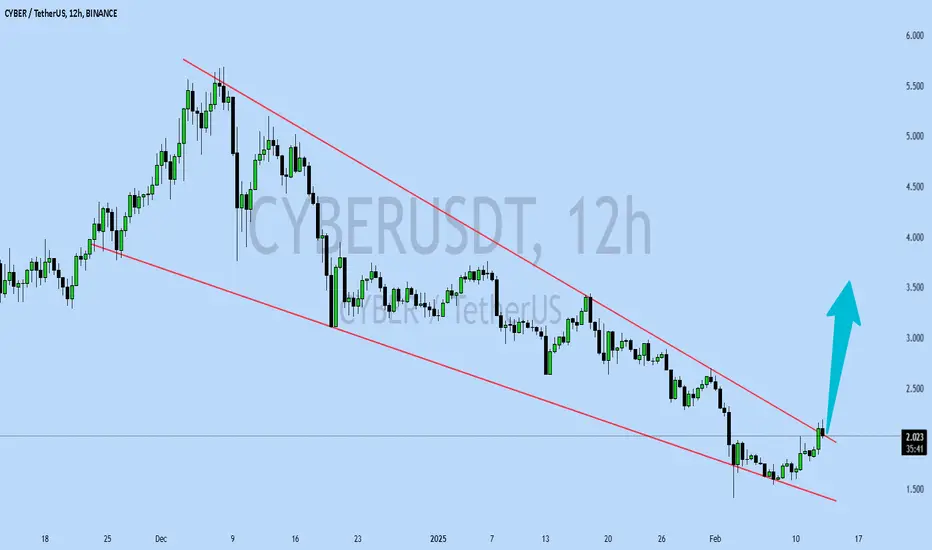
CYBERUSDT UPDATECYBERUSDT is a cryptocurrency trading at $2.026. Its target price is $3.500, indicating a potential 70%+ gain. The pattern is a Bullish Falling Wedge, a reversal pattern signaling a trend change. This pattern suggests the downward trend may be ending. A breakout from the wedge could lead to a strong
Cyber IAP model. What next?BINANCE:CYBERUSDT
Recommend you check education idea about IAP model, how to analyse coins after listing
Possible Targets and explanation idea
➡️After IAP model on 4H we can see correction
➡️Correction will be to first target is Buy line on Take profit indicator
➡️This level also will be a test

#CYBER (SPOT) IN ( 2.600- 3.100) T.(12.000) SL(2.557)BINANCE:CYBERUSDT
#CYBER/ USDT
Entry( 2.600- 3.100)
SL 1D close below 2.557
T1 5.200
T2 6.800
T3 9.000
T4 12.000
______________________________________________________________
Golden Advices.
********************
* collect the coin slowly in the entry range.
* Please calculate your losses befor

CYBERUSDT 3DCYBER ~ 3D
#CYBER If you still have Conviction on this coin,. This support block would be a very good buying place for now,. Buy in stages with a minimum target of 20%++

Is CYBERUSDT on the Verge of a Major Breakout? Yello Paradisers! Are you watching CYBERUSDT closely? If not, now’s the time. We’re at a critical point with a textbook W-pattern forming right at the supportive trendline of the ascending channel, and things are heating up! Let’s break it down.
💎The pair is currently respecting the ascending chann

Cyber is waking upI am a newbie trader who works on simple charts and simple results. Cyber woke up already test support and go higher is inevitable

50% pump on CYBERA falling wedge pattern is observed on $CYBERUSDT.
A measured move gives a potential 50% price increase to about $5.2
Action
Buy $3.5- $3.78
Stop loss- $3.0
Take profit $5.5
Good luck!!

See all ideas
Summarizing what the indicators are suggesting.
Oscillators
Neutral
SellBuy
Strong sellStrong buy
Strong sellSellNeutralBuyStrong buy
Oscillators
Neutral
SellBuy
Strong sellStrong buy
Strong sellSellNeutralBuyStrong buy
Summary
Neutral
SellBuy
Strong sellStrong buy
Strong sellSellNeutralBuyStrong buy
Summary
Neutral
SellBuy
Strong sellStrong buy
Strong sellSellNeutralBuyStrong buy
Summary
Neutral
SellBuy
Strong sellStrong buy
Strong sellSellNeutralBuyStrong buy
Moving Averages
Neutral
SellBuy
Strong sellStrong buy
Strong sellSellNeutralBuyStrong buy
Moving Averages
Neutral
SellBuy
Strong sellStrong buy
Strong sellSellNeutralBuyStrong buy
Displays a symbol's price movements over previous years to identify recurring trends.