DEGOUSDT.P trade ideas

DEGOBTC LONG short TFlooking at a bounce back on this altcoin from yesterdays flashcrash, nice easy TP hopefully to 15ish.
NFA DYOR

DEGO##########################################################################################
DISCLAIMER: This is NOT FINANCIAL ADVICE.. THIS IS FOR EDUCATIONAL PURPOSES ONLY
##########################################################################################

#DEGO #DEGOUSDT #DEGOBTC %271 BULLISH PERIYOD IS STARTING :))BULLISH PERIYOD IS STARTING AND GET REDY TO THE MOON


DEGOUSDT Triangle FormationDEGOUSDT (1H Chart) Technical Analysis Update
Triangle formation
DEGO/USDT currently trading at $18.00
Buy-level: Above $18.75 (only buy if 1h candle closes above the triangle)
Stop loss: Below $17.00
Target 1: $19.45
Target 2: $20.20
Target 3: $22.00
Max Leverage: 3X
ALWAYS KEEP STOP LOSS...
Follow Our Tradingview Account for More Technical Analysis Updates, | Like, Share and Comment Your thoughts.


DEGO testing the support zoneDEGO is an NFT and DeFi project and NFT coins are doing very well in this bull run. DEGO now testing the support line and we expecting a good bounce from here. DEGO broke the long downtrend with a big volume candle and now accumulation is going on for the next leg up.
Buy Zone: $16.8 - $17
Target: $18.78 - $19.94 - $21.2 - $23.6 - $26.8 - $28.9 - $31.3 - $34.4 - $38.7

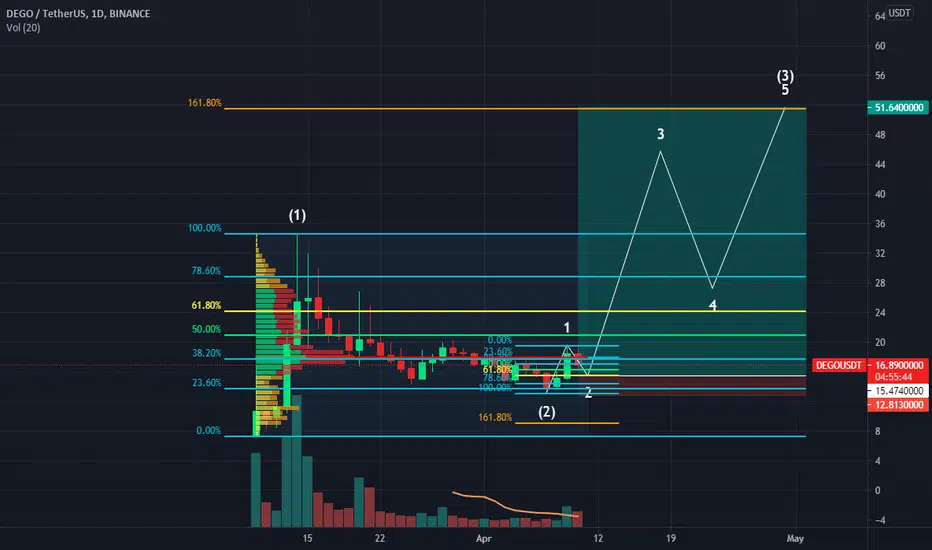
DEGO could be a nice hold for the next monthDEGO has seen a wave (1) come in very quickly upon listing, followed by wave (2). We think that (2) has now completed because of the smaller degree move up labeled as 1, which is likely to be followed by an enormous move up. This is because wave (3) will tend to target the 161.8% extension of wave (1), as shown on the chart for the take profit level.
This trade will take entry either at 15.50 (the 61.8% retracement of wave 1), or when price is able to break above the Point Of Control shown by the red line at 17.8 again.
DEGO Broke it's bearish trend and enters new upward channelAs you can see above, DEGO is in a new trend and is no more going down

DEGO 400% profit chance in mid termSell Zone for me: 75 usdt
Third Target: 50 usdt
Second Target: 33 usdt
First Target: 23 usdt


Dego Cup + Handle completed. 19.5 $ stop Dego Cup + Handle completed. Volume confirmation done.
Safe buy zone 17.40 $
Stop : 19.5-20$ (if you like risk above 20 $)
Profit : %15-20
This is not an investment advice.

DEGOUSDTHi all,
DEGO is new coin on Binance exchange so chart isn´t so long... but TA give us awesome RRR. We have to try to go IN.
Who want - wait for touch of support line but I´ll go IN right now.
Danger: As always BTC and dominantion - because this is SHITcoin. So use SL and you can sleep well :-)
LbL_CZ


DEGOUSDT (DEGO FINANCE) - BULLISH SETUP ANALYSIS 🔎
- DEGOUSDT hit an ATH and retraced.
- Price retested the flip horizontal support (FHS) and key fibonacci retracement zone (0.5 - 0.618 - 0.786).
- There was a relatively high concentration of buyers at the retest zone.
- The retracement was bounded in the falling wedge (FW) pattern.
- The falling wedge pattern is a bullish reversal pattern.
- Price brokeout above the falling wedge's resistance as expected.
- This is a bullish signal.
- Price action is printing the double bottom neckline on pattern.
- The double bottom pattern is a bullish reversal pattern.
- The downtrend at the right bottom was resisted by the descending trendline resistance (DTR).
- Price brokeout above the descending trendline resistance.
- This is a bullish signal.
BUY ENTRY ⬆️
- Market price.
TARGETS 🎯
- Horizontal resistance level (R1) / Neckline resistance (NR).
- Horizontal resistance level (R2).
- Horizontal resistance level (R3).
- Fibonacci extension levels.
SETUP INVALIDATION ❌
- Initial invalidation : breakdown below the double bottom horizontal support level (S1).
- Final invalidation : breakdown below the 0.786 fibonacci retracement level.


#DEGO has plenty to go$DEGO has still a lot to go, with that break out the way is up to previous top or for a new ath, min.110% potential with a great R:R, one of those alts you should get at this low.

