Sledding candles and a dream delayed.Earlier this week I published a chart projecting DIA to slide to $1.25 and $1.15 at the very low end after it broke an multiday support channel. This wasn't all that revolutionary as the Fib Fan and the Fib BBs I used aligned on a older support line. I despite predicting this lamented when it struck this bottom channel, as someone who hold a large bag of DIA personally As of now because Binance has kicked me off, finding out have been trading from America with future. Bbeen forced to move my DIA tokens to an effective cold wallet, where if I want to trade I have to eat high ETH transfer fees as I negotiate with Uniswap or any other Token exchange. All in all it has left me a helpless passenger on a treacherous chart for a project I simultaneously believe in and also could see crash below a dollar a token.
Just 1hr ago in what seemed like a single 5m candle DIA rejected staying above the 0.618 fib at 1.413 and decided it was going to go off Niagara falls barrel style into the lower 0.79 fib at 1.3~~. DIA doing so with a unreal spike of volume not seen since 5 days ago. Could it be that someone is keeping the price down low to load up more before this become another moon token the rabid TV Crypto fawns over or someone seeing an ideal time to dump and exit the equivalent of over $750k. That I do not know but it seems to cement DIA into a rising wedge formed by this new bounce and the 0.618 Fib. I well and truly though before this monster of a candle DIA had a good chance of a clean breakout to 2$ near term but these 30s of live action candle violence dissuade me from thinking that a stable upward march like what is seen on Link in the past few days is anything but possible. I am net neutral but watching closely as my wallet doesn't really have a form of stop loss exchange setup.
DIAUSDT trade ideas

DIA 1.25 Likely in the cards short termWell looks like DIA failed a breakout earlier above 1.7$. This Project has a excellent team of people behind it and a great directive and goal I have quite a bit myself though purchased at 3$, 1.5$ and 1.3$. But it unfortunately seems to want to torture us bagholders a little longer and flirt with the bottom supports confirmed by multiple types of fibs. Because of sky high ETH fees and my inability to access DIA on a regular exchange (USA resident) its not quite worth it for me to sell and rebuy but I am watching closely. Hopefully this is a blip and we can see it march higher in line with the other cryptos out there. The biggest fear on this project because it is so open sourced community based is the community loosing interest, its seen a slowdown of recent tickets being closed after a flurry of activity months ago. Yet new partnerships are announced multiple times a week, at least from the centralized foundation. I believe DIA has a lot of room to go if it gets the attention it deserves and perhaps 1.25 might be the lowest it might be all year. Lets see how the next 12hrs play out.


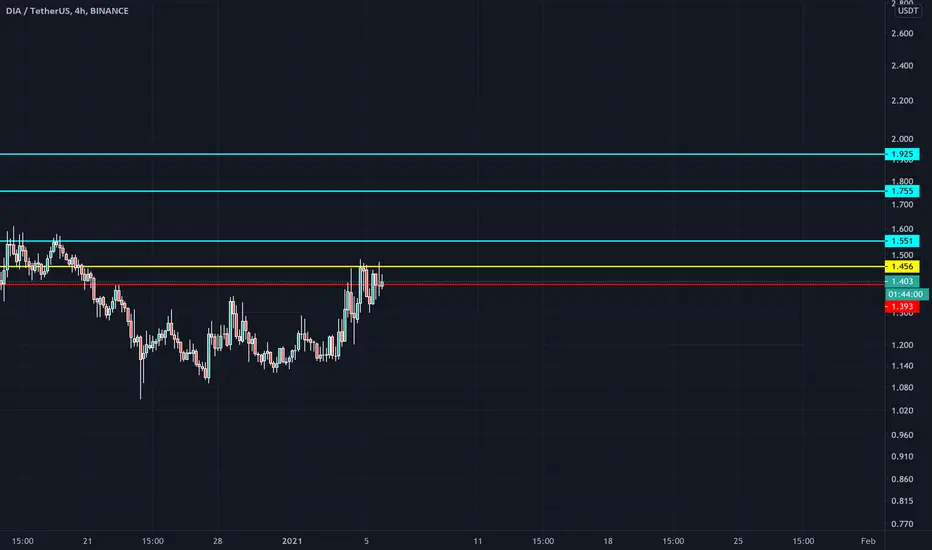
DFT H4 - DIA derisked for medium term long positionDIA is finally derisked for medium term. Will wait a last pull back before entering for cross validation but you can start to buy the next dips.
-Short term is still ranging.
-Medium term is building up its bullish momentum.
-Relative volume is increasing.
h4 mapping of the price, we map, forecast not predict in Multi UT analysis ;)
gl
////// FFT - STRAT //////
Some rules to understand the form of the strategy: (Can answer to your question about the content of DFT strategy :) )
- shade of red trends = primary (the black one are secondary trends)
- Redish trends is primary as medium investors are arbitring short/long term investors decisions.
Div: Trend vs demand/supply
-Ascending trends with red cloud is most likely tested twice before break up.
-Descending trends with green cloud is most likely tested twice before break up.
Conv: Trend vs demand/supply
-Ascending trends with green cloud doesn't need retest to break up.
-Descending trends with red cloud doesn't need retest to break down.
-MA follows Geometrical expension 2^n (32 128 512) to match snowball market effect and have a linear scale btw sampling and TF.
red cloud = supply area (Ma max negative deviation) + Cloud cluster = sell wall (cluster of MTF deviation)
green cloud = demand area (MA max postive deviation) + cloud cluster = buy wall (cluster of MTF deviation)
node = lowest uncertainty point & supply=demand (no deviation)


Looking quite solidInfo : Just a random ramble from a broke student that wish he'll become a whale.
It broke of the top of the descending trendline, we'll see it down to bounce off from the horizontal support and then we fly..


DIA Targets - TrialPotential target zones for DIA. Seems like the trend is broken. It will probably retest the trend line and then start moving upwards

DIA bear flagPrice bounced of 1.04 support forming a bear flag that is likely to break down. Targets are 0.925 and 0.819. A fall below 0.819 is very bearish for DIA.


DIAUSDT - Long - Potential 12.77%DIAUSDT - Long - Potential 12.77%
Entry- 1.551
TP1- 1.610
TP2- 1.748
SL- 1.444
- BTC at strong point of resistance rejection possible - High Risk Trade with Small Targets/Risk
- RR - 1.87
- Trailing Buy - 0.5%
- Trailing Profit - 1%
- Trailing Stop-Loss - No

DIA 12HR MACD Turning Bullish!Looks like the MACD on the 12HR is about to turn bullish, and shortly after the 1D. I expect us to pass $2 within a few days. Easy play.
*DYOR - NOT FINANCIAL ADVICE**


$DIA CUP AND HANDLEOur beautiful Parabola broke and now we are looking at a Cup and Handle setup. If BTC Dominance drops, this will shoot sky high and back towards our original goal. Don't miss the moon!
**DYOR - NOT FINANCIAL ADVICE**


