US30: Bullish Breakout on the Horizon – Next Target 44,000? US30: Bullish Breakout on the Horizon – Next Target 44,000?
Since our last analysis, US30 has climbed +2.7%, rising from 39,300 to 40,400.
The price is nearing a breakout from a large bullish triangle, which could trigger an even bigger upward move.
After hitting a low of 36,500 on April 7, US30 has been steadily rising, forming a strong triangle pattern. A breakout could start a powerful wave toward 44,000.
You may find more details in the chart!
Thank you and Good Luck!
❤️PS: Please support with a like or comment if you find this analysis useful for your trading day❤️
Previous analysis:
DJI trade ideas

US30 Approaching Key Resistance Within Rising Channel:🧠 Chart Context & Overview
Chart Type: Candlestick
Time Frame: Appears to be Daily (based on price action and spacing of dates)
Current Price: ~$40,798.4
Indicators:
EMA 50 (Red): ~40,065.2
EMA 200 (Blue): ~41,475.6
Trend Structure: Ascending channel with higher highs and higher lows forming since early April.
🔍 Technical Breakdown
📈 Trend Analysis
The price is moving within a rising parallel channel, respecting both upper and lower boundaries.
The recent bullish candles indicate momentum building towards a breakout or test of resistance.
🔄 EMA Confluence
Price is above the 50 EMA, showing short-term bullish momentum.
EMA 200 is acting as overhead resistance (~41,475), aligned with the top of the channel—a key decision zone.
📊 Support & Resistance Levels
Immediate Resistance: ~41,475 (EMA 200 & upper channel boundary).
Support Levels:
~40,065 (EMA 50)
~39,000 (mid-channel support zone)
~38,000 (lower channel boundary)
📌 Scenarios to Watch
✅ Bullish Case:
A clean breakout above the channel and the 200 EMA (~41,475) with strong volume could trigger a trend continuation toward:
42,500 – next psychological and historical resistance
Potentially higher if macro sentiment aligns
⚠️ Bearish Case:
Rejection at 200 EMA or the upper channel could lead to:
A pullback to the mid-channel zone (~39,800–40,000)
Further downside to retest the lower channel support (~38,000)
📅 Outlook
The chart currently supports a bullish bias within an uptrend structure, but the key resistance zone (41,475) must be broken decisively for confirmation. Watch for volume and candle structure near that level to assess breakout validity.

Dow Jones Potential UpsidesHey Traders, in today's trading session we are monitoring US30 for a buying opportunity around 40400 zone, Dow Jones is trading in an uptrend and currently is in a correction phase in which it is approaching the trend at 40400 support and resistance area.
Trade safe, Joe.
KEEP BUY ON US30!!!!!!Yesterday us30 completed +3,700pips from my entry point right now we have a liquidity sweep from the sell side am still going long from this point with my initial target at 40,701
JOIN AND ENJOY.........

Dow Jones Swing Short IdeaComing off All Time Highs after a trump victory rally it is time for an exhausted bull market to come back and find fair value for the real bulls that buy this. the amount of greed that's sits currently in this market is to dream of for bears, and their time haas come 34500 inbound...this target should come through in the next 12month candle so its a long term leap trade.
DXY has been coming down too much, it's time to hit the kill switch on stocks and worry more on the dollar and all this inflation/tarriffs/war/ trump/ etc . DXY up = stocks down

US30 LOCAL SHORT|
✅DOW JONES is going up now
But a strong resistance level is ahead at 40,947
Thus I am expecting a pullback
And a move down towards the target of 40,314
SHORT🔥
✅Like and subscribe to never miss a new idea!✅
Disclosure: I am part of Trade Nation's Influencer program and receive a monthly fee for using their TradingView charts in my analysis.

Everyone I am shorting DOW/US30Team I am shorting DOW, - MUST have stop loss the price could hit 40912-16 - but short slowly now, with STOP loss at 40960-65
Target 1 at 40750-40735 - reduce 30% volume
Target 2 at 40650-40600 - reduce 50% volume
Target 3 at 40550-740483 - remaining
Once the price reaches the first target, bring STOP LOSS TO BE
NEXT week, I will be releasing a video on how I made 1000% profit in 4 weeks. I would love to share my strategy with the world.

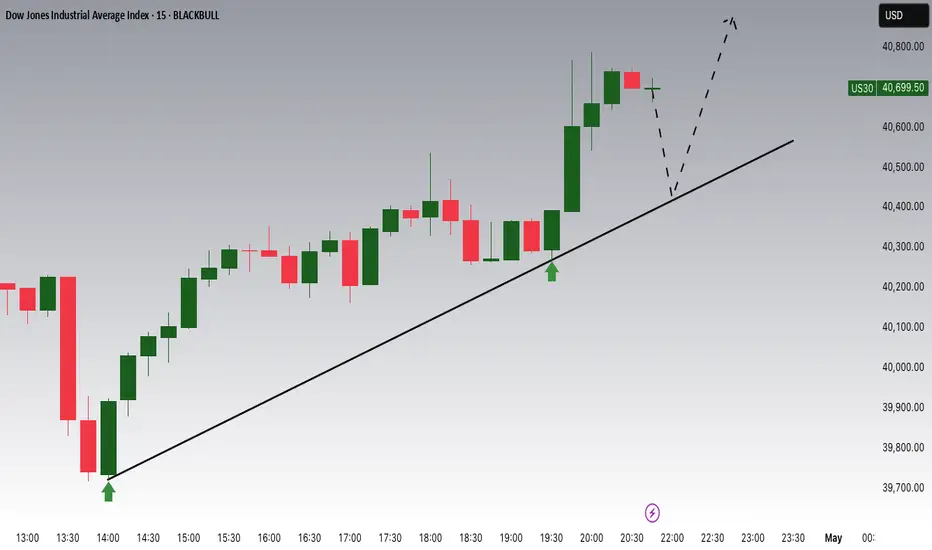
Trade Idea: Long Bias on US30I'm currently monitoring a potential long setup on US30. Price has broken out of a consolidation zone and is respecting an ascending channel. A breakout and retest pattern is forming around the upper trendline, with strong bullish momentum following a clean break of resistance near 40,350. I'm anticipating a brief pullback toward the breakout area (marked by the demand zone and retest block), followed by a continuation to the upside toward the 40,620–40,650 supply zone.
Trade Direction: Long
Entry Zone: 40,350–40,375 (on retest confirmation)
Target: 40,620–40,650
Invalidation: Clean break below 40,300
Context: Strong impulsive breakout + channel breakout with clear liquidity sweep below prior lows.
📌 Disclaimer: This is my personal analysis and should not be taken as financial advice. I’m still learning and refining my strategy — please do your own research and manage your risk carefully.
Us 30 target sellBecause patten DBtop and price go to Fibonacci 50% and SND zone Drop base Drop.. possibility the good zone to sell

US30 TO TANK DOWN!!!??Good day traders, unlike on US100 and S&P500 US30 is showing failure to break higher highs and is forming lower lows using or Golden zones, currently inside the range that i outlined we have a bearish market structure shift, i am expecting the market to tap into our FVG @40075.5 then tank down tho our sellside liquidity @39721.3
ENTRY:40075.5
SL: 40190.0
TP:39721.3

Potential Formation of a Triangle Pattern ObservedOn the daily timeframe, the Dow Jones movement currently presents two possible scenarios.
Under the black label, there is a potential formation of a triangle pattern, suggesting that the Dow Jones may enter a prolonged consolidation phase to complete wave B, with an expected range between 38,200 and 40,400.
However, under the red label (alternative scenario), a bearish triangle could be forming as part of wave X.

DOW JONES Are you willing to bet against a 15 year pattern?Dow Jones (DJI) will close the month today with a massive rebound 1M candle after almost touching its 1M MA50 (blue trend-line). Since the October 2010 break above the 1M MA50, after the market recovered from the 2008 Housing Crisis, the 1M MA50 has been the ultimate long-term Buy Entry as it has always signaled rallies that ranged from +58% to +67%.
The 1M MA50 has also kept the index mostly within the 0.382 - 0.786 Fibonacci range (blue zone) of the multi-year Channel Up. Given also that the 1W RSI also reached in April its ultimate Buy Zone (green), we view this as the best long-term Buy Signal the index handed to us since the September 2022 bottom of the Inflation Crisis.
Since the Bullish Legs that followed have been fairly consistent on average, we expect another 58% rise minimum. Assuming a 'bad-case' scenario of being contained within the 0.786 Fib, then a 56000 long-term Target seems more than fair.
Are you willing to go against this pattern?
-------------------------------------------------------------------------------
** Please LIKE 👍, FOLLOW ✅, SHARE 🙌 and COMMENT ✍ if you enjoy this idea! Also share your ideas and charts in the comments section below! This is best way to keep it relevant, support us, keep the content here free and allow the idea to reach as many people as possible. **
-------------------------------------------------------------------------------
💸💸💸💸💸💸
👇 👇 👇 👇 👇 👇

US30: Long Position Setup – Buyers Target Key ResistanceOverview:
The US30 index (Dow Jones Industrial Average) presents a clear long setup as price tests a crucial support zone, with potential bullish momentum targeting higher resistance levels. The chart's long position tool highlights a well-defined risk-to-reward framework.
Key Details from the Chart:
Long Position Tool Breakdown:
Entry Point: Price hovering near the support level, suggesting a strong buying opportunity.
Stop-Loss Level: Positioned slightly below the support to limit downside risk.
Take-Profit Target: Aiming for the next resistance zone above current price levels.
Support and Resistance Analysis:
Support Zone: A reliable level where buyers have repeatedly entered the market.
Resistance Zone: Above the take-profit target, where sellers might step in and stall upward movement.
Volume Insights:
Increased buying interest near the support level signals bullish sentiment. Volume profile analysis confirms strong participation at these levels.
Long Trade Plan:
Entry Strategy: Initiate long positions near the support level, ensuring confirmation with bullish candlestick patterns or a surge in buying volume.
Stop-Loss Placement: Secure the position with a stop-loss below the support level to protect against adverse price movements.
Take-Profit Levels: Target the resistance zone, maximizing potential gains while maintaining favorable risk management.
Market Sentiment:
The chart reflects growing buyer interest, with price action likely to push higher as long as the support zone holds. Traders should remain vigilant for reversal signals and manage positions accordingly.
Closing Thoughts: This long trade setup on US30 offers a well-balanced approach, allowing traders to capitalize on bullish momentum while minimizing risk. As always, patience and discipline are key to executing trades effectively.

Hanzo | US30 15 min Breaks – Confirm the Next Bullish Move🆚 US30 – Hanzo’s Strike Setup
🔥 Timeframe: 15-Minute (15M)
——————
💯 Main Focus: Bullish Breakout at 40500
We are watching this zone closely.
———
Analysis
👌 Market Signs (15M TF):
• Liquidity Grab + CHoCH at 40420
• Liquidity Grab + CHoCH at 39870
• Strong Rejections seen at:
➗ 39900 – Major support / Key level
➗ 40300 : 40400 – Proven resistance
🩸 Key Zones to Watch:
• 40200 – 🔥 Bullish breakout level X 3 Swing Retest
• 40550 – Strong resistance (tested 5 times)
• 40200 – Equal lows
• 40420 – Equal highs

Bearish drop off overlap resistance?Dow Jones (US30) is reacting off the pivot which has been identified as an overlap resistance and could drop to the 1st support.
Pivot: 40,653.80
1st Support: 39,356.30
1st Resistance: 41,490.90
Risk Warning:
Trading Forex and CFDs carries a high level of risk to your capital and you should only trade with money you can afford to lose. Trading Forex and CFDs may not be suitable for all investors, so please ensure that you fully understand the risks involved and seek independent advice if necessary.
Disclaimer:
The above opinions given constitute general market commentary, and do not constitute the opinion or advice of IC Markets or any form of personal or investment advice.
Any opinions, news, research, analyses, prices, other information, or links to third-party sites contained on this website are provided on an "as-is" basis, are intended only to be informative, is not an advice nor a recommendation, nor research, or a record of our trading prices, or an offer of, or solicitation for a transaction in any financial instrument and thus should not be treated as such. The information provided does not involve any specific investment objectives, financial situation and needs of any specific person who may receive it. Please be aware, that past performance is not a reliable indicator of future performance and/or results. Past Performance or Forward-looking scenarios based upon the reasonable beliefs of the third-party provider are not a guarantee of future performance. Actual results may differ materially from those anticipated in forward-looking or past performance statements. IC Markets makes no representation or warranty and assumes no liability as to the accuracy or completeness of the information provided, nor any loss arising from any investment based on a recommendation, forecast or any information supplied by any third-party.

A CLEAR SELL SET UP ON US30US30/WALLSTREET30 is on down trend. It made an impulse ,retested two times and it is about to continue with impulsive movement

DOW JONES: The most critical 1D MA50 of all.Dow Jones is neutral on its 1D technical outlook (RSI = 52.914, MACD = -282.250, ADX = 30.751) but has completed 5 green 1D candles in a row, going for the all important Resistance test of the 1D MA50. This trendline has been intact since March 3rd and is on a crucial Resistance cluster as this is where the LH trendline from the ATH is. The 1D RSI is already on an Inverse H&S, which is a positive sign but we need to see a candle closing over the 1D MA50 to validate the restoration of the long term bullish trend. If succesful, we will turn long and target the ATH Resistance (TP = 45,000), which is also just under the 2.0 Fib extension.
## If you like our free content follow our profile to get more daily ideas. ##
## Comments and likes are greatly appreciated. ##

US30What is US30?
The US30, also known as the Dow Jones Industrial Average (DJIA) or simply the Dow 30, is a widely followed stock market index that tracks the performance of 30 large, publicly traded U.S. companies. These companies are considered some of the most important and influential in the U.S. economy, representing a diverse range of sectors such as technology, healthcare, finance, consumer goods, and industrials.
The index is price-weighted, meaning that stocks with higher share prices have a greater impact on the index’s value than those with lower prices. The DJIA is calculated by adding the prices of all 30 component stocks and dividing by a divisor that adjusts for stock splits and other corporate actions.
The US30 acts as a barometer of the U.S. stock market and overall economic health, though it only includes 30 companies and is not weighted by market capitalization like the S&P 500.
Companies That Make Up the US30 (As of 2025)
The 30 companies in the US30 include some of the largest and most influential U.S. corporations:
Apple Inc. (AAPL) – Technology
Microsoft Corporation (MSFT) – Technology
Nvidia Corporation (NVDA) – Technology
Visa Inc. (V) – Financial Services
Johnson & Johnson (JNJ) – Healthcare
Procter & Gamble Company (PG) – Consumer Goods
Walmart Inc. (WMT) – Retail
JPMorgan Chase & Co. (JPM) – Financial Services
The Coca-Cola Company (KO) – Consumer Goods
The Home Depot, Inc. (HD) – Retail
McDonald's Corporation (MCD) – Consumer Services
UnitedHealth Group Incorporated (UNH) – Healthcare
The Travelers Companies, Inc. (TRV) – Insurance
The Boeing Company (BA) – Aerospace & Defense
Amgen Inc. (AMGN) – Biotechnology
Goldman Sachs Group, Inc. (GS) – Financial Services
Caterpillar Inc. (CAT) – Machinery
Merck & Co., Inc. (MRK) – Pharmaceuticals
Salesforce, Inc. (CRM) – Technology
Chevron Corporation (CVX) – Energy
IBM Corporation (IBM) – Technology
Honeywell International Inc. (HON) – Industrials
Cisco Systems, Inc. (CSCO) – Technology
The Walt Disney Company (DIS) – Media & Entertainment
Nie, Inc. (NKE) – Consumer Goods
Verizon Communications Inc. (VZ) – Telecommunications
American Express Company (AXP) – Financial Services
3M Company (MMM) – Conglomerates
Walgreens Boots Alliance, Inc. (WBA) – Retail
Dow Inc. (DOW) – Chemicals
How Bond Yields and the US Dollar (DXY) Affect US30 Price Movement
Bond Yields Impact
Rising bond yields (especially U.S. Treasury yields) generally increase borrowing costs for companies, which can dampen corporate profits and weigh on stock prices, including those in the US30.
Higher yields can also make bonds more attractive relative to stocks, causing some investors to shift capital out of equities and into fixed income, putting downward pressure on the US30.
Conversely, falling bond yields reduce borrowing costs and can boost stock valuations, supporting gains in the US30.
US Dollar Index (DXY) Impact
The US Dollar Index (DXY) measures the strength of the dollar against a basket of major currencies.
A stronger dollar can hurt multinational companies in the US30 by making their exports more expensive and reducing the value of overseas earnings when converted back to USD, often leading to downward pressure on the index.
A weaker dollar tends to support US30 companies with significant international sales, potentially boosting the index.
Additionally, dollar strength often reflects risk-off sentiment, which can coincide with stock market declines, while dollar weakness often aligns with risk-on sentiment and rising equities.
Summary
Factor Effect on US30 Price Movement
Rising Bond Yields Negative: Higher borrowing costs, shift to bonds
Falling Bond Yields Positive: Lower borrowing costs, stocks more attractive
Stronger US Dollar Negative: Exporters hurt, overseas earnings worth less
Weaker US Dollar Positive: Boosts multinational earnings, supports stocks
In essence, the US30 reflects the performance of 30 major U.S. companies weighted by stock price. Its price movements are influenced by macroeconomic factors such as bond yields and the US dollar, which affect corporate profitability and investor risk appetite.

Hanzo | US30 15 min Breaks – Will Confirm the Next Move🆚 US30 – Hanzo’s Strike Setup
🔥 Timeframe: 15-Minute (15M)
——————
💯 Main Focus: Bullish Break Out at 41280
We are watching this zone closely.
💯 Main Focus: Bearish Break at 40990
We are watching this zone closely.
———
Analysis
👌 Market Signs (15M TF):
• Liquidity Grab + CHoCH at 40850
• Liquidity Grab + CHoCH at 41400
• Strong Rejections seen at:
➗ 41000 – Major support / Key level
➗ 40600 – Major support / Key level
➗ 41280 – Proven resistance
🩸 Key Zones to Watch:
• 40990 – level X 6 Swing Retest
• 41270 – Strong resistance (tested 5 times) /15min
• 41000 – Equal lows
• 41400 – Equal highs

YM (US30): Trend in daily time framePlease pay special attention to the accurate trend, channels, and magic colored levels.
Its very sensitive setup, ...............<<<<<<<<<<<<<<<<<<<<<<<
Be careful
BEST
MT

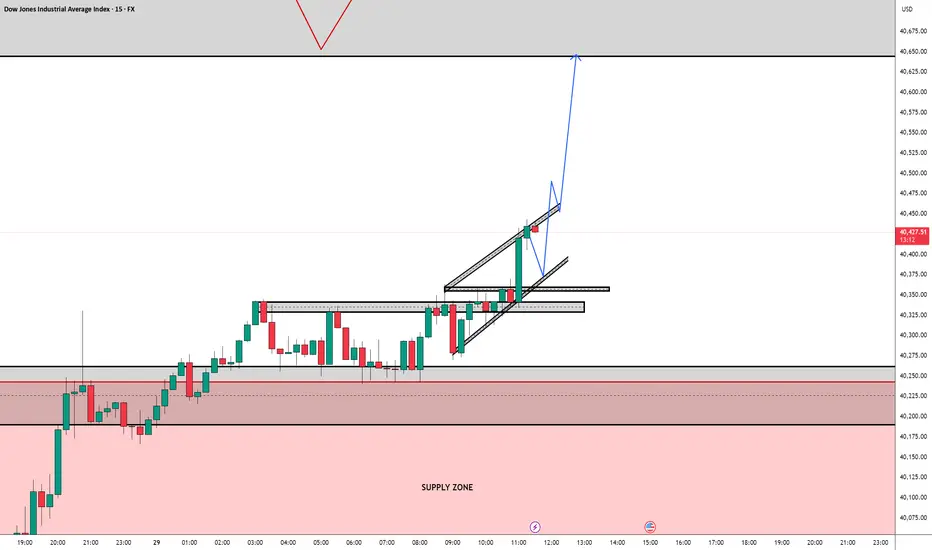
US30 (Dow Jones) – Short Setup in Play – May 2, 2025🔍 Setup Summary:
Price is trading within a bearish internal channel and has shown a reaction from a lower high inside the upper boundary. There’s clear intent to grab liquidity, possibly sweep the short-term high above the descending wedge, then reject sharply.
📉 Trade Idea:
Looking for price to spike up toward the upper channel resistance (~41,250–41,300), potentially sweep liquidity, then reject and break below the ascending trendline. A clean short could target the 15-min FVG zone and demand block around 40,600, with extended targets toward 40,300.
✅ Confluences:
Bearish market structure and channel
Potential liquidity sweep + internal market trap
Fair Value Gap + previous demand zones below
Trendline break setup for entry confirmation
📌 Bias: Bearish – short-term rally expected before a move lower
🕒 Timeframe: 15-minute chart
📈 Risk-to-Reward: 2.5–3:1 depending on entry point and target zone
⚠️ Disclaimer:
This is my personal outlook based on technical analysis. It is not financial advice. Always conduct your own research, manage risk appropriately, and use proper trade management. Markets carry risk — trade safe.

Is It Over?Today's red Doji candle at the underside of the downtrend line is a high potential short entry point if not already. Despite the rally the past week or so, it is far from convincing...no real conviction to buy this market and who can blame them.
The current wave 2 bounce will be followed by wave 3 down as the most likely scenario, or we are in a wave 4 to be followed by a wave 5 to complete, any firm close below the lows gives us our answer.
Gold is selling off, our $3400 target was met and reversed in a now wave 4 down, this may approach the $3160 area, or a sideways move before another strong wave 5 up.
This is a great opportunity to accumulate physical metals to protect yourself from the coming reset.
Appreciate a thumbs up, Good Trading and God Bless you all!

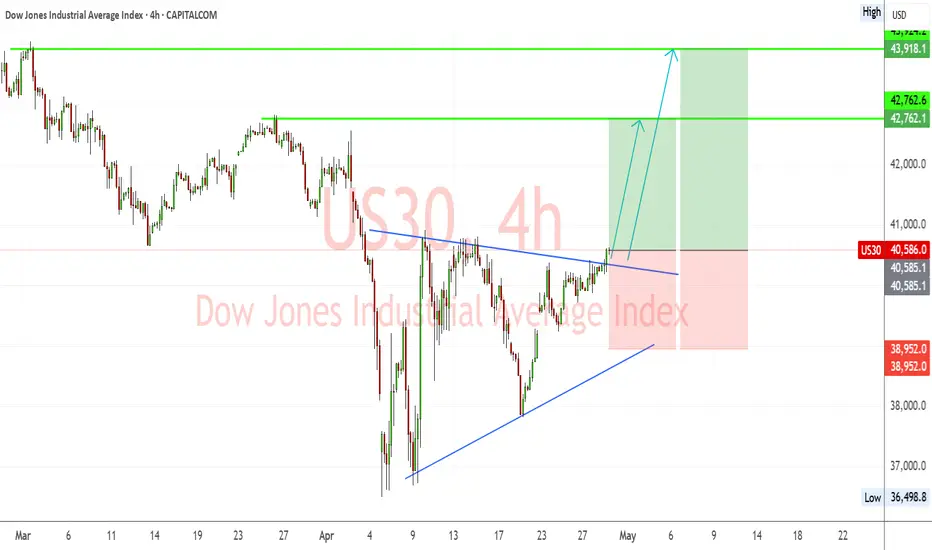
US30 Breakout from Symmetrical Triangle – Bullish Targets EyedUS30 (Dow Jones) has successfully broken out of a symmetrical triangle consolidation pattern, signaling a shift toward bullish momentum. The breakout is occurring after a strong recovery from April lows, with higher lows supporting upward price pressure.
🔹 Chart Structure:
Symmetrical triangle with a clean breakout above descending resistance.
Series of higher lows indicating accumulation.
Bullish breakout confirmed with price pushing above the 40,580 zone.
🔑 Key Levels:
Current Price: 40,586
Breakout Confirmation Level: 40,580
Immediate Resistance/TP1: 42,762
Major Resistance/TP2: 43,924
Support Zone: 38,950
Invalidation/Stop Level: Below 38,950
✅ Bullish Confluence Factors:
Breakout of symmetrical triangle pattern
Higher lows indicate bullish strength and accumulation
Momentum shift visible on lower timeframes
Positive correlation with improving US equity market sentiment
Anticipation of dovish Fed tone could boost equities
🧠 Fundamental Context:
Market is cautiously optimistic ahead of FOMC this week; dovish stance expected due to recent soft economic indicators.
Earnings season tailwinds and lower bond yields support index gains.
Ongoing political and tariff-related headlines may cause volatility, but technical breakout remains in focus.
💡 Trade Idea:
Bias: Bullish
Entry: On successful retest of 40,580 or continuation above 40,600
TP1: 42,762
TP2: 43,924
Stop Loss: Below 38,950
📌 Note: Watch for pullbacks to triangle resistance-turned-support. FOMC and US macro data releases midweek can impact momentum.