Short trade
Trade Overview: DOGEUSD – Short Position
Entry Price: 0.17342
Take Profit: 0.16700 (+3.70%)
Stop Loss: 0.17277 (–0.37%)
Risk-Reward Ratio (RR): 10.90
🕗 Entry Time: 8:40 PM (NY Time)
📅 Date: Saturday, 26th April 2024
🌍 Session: Tokyo PM
🧭 Bias: Sell-Side
Reasoning Narrative
DOGEUSD presented a high-probability short opportunity during the Tokyo PM session, following a clear sign of exhaustion at intraday highs. Price had just tapped into a previous supply zone and formed a liquidity sweep above local highs before aggressively reversing, suggesting that buy-side liquidity had been engineered and consumed.
DOGEUSDT.P trade ideas

$DOGE going to 0.50$ This chart provides an updated technical outlook on Dogecoin (DOGE) against USDT on the daily timeframe, showcasing a significant shift in market structure. After months of descending price action, DOGE has successfully broken out of its long-standing downtrend, reclaiming momentum with a clean breakout above the resistance trendline.
The highlighted green zone reflects a strong accumulation base near the $0.13–$0.14 range, which held as critical support during the recent consolidation phase. The breakout above this structure, accompanied by a subtle increase in volume, suggests renewed buying interest and a potential trend reversal.
The yellow zone outlines two bullish targets:
Lower Timeframe (LTF) Upside: $0.21 – $0.26 – $0.30
Higher Timeframe (HTF) Upside: $0.35 – $0.40 – $0.50
These levels correspond to Fibonacci retracement zones and past resistance points, providing likely profit-taking zones for traders.
However, the bullish thesis remains valid only as long as the price holds above $0.13 on a daily closing basis. A close below that level would invalidate the breakout and reintroduce bearish risk.
Overall, DOGE is showing promising bullish potential with well-defined targets, making it a chart to watch closely for further upside in the coming weeks

Say hello to the 75-cent Dogecoin!So if you pay attention to the DOGECOIN chart you can see that the price has formed a Ascending FLAG which means it is expected to price move as equal as the measured price movement.( AB=CD )
NOTE: wait for break of the FLAG .
Give me some energy !!
✨We spend hours finding potential opportunities and writing useful ideas, we would be happy if you support us.
Best regards CobraVanguard.💚
_ _ _ _ __ _ _ _ _ _ _ _ _ _ _ _ _ _ _ _ _ _ _ _ _ _ _ _ _ _ _ _
✅Thank you, and for more ideas, hit ❤️Like❤️ and 🌟Follow🌟!
⚠️Things can change...
The markets are always changing and even with all these signals, the market changes tend to be strong and fast!!

DOGE/USDT Support Zones (Blue Boxes)DOGE saw a strong volume spike today, so it’s on the radar. I’ve outlined the major blue boxes that mark demand zones. These areas have shown solid reaction in the past, and I’ll only consider longs if the price enters them with a clean LTF confirmation.
If we get a controlled pullback into the upper blue box, I’ll be watching closely for absorption signs. If that fails, the mid-range blue box becomes the next area of interest. The lowest blue box is where I’d expect strong defensive behavior — but only if we drop that far with a clear setup.
No guessing. No chasing. Only entries if we see clear commitment from buyers.
🔴 DOGE/USDT Resistance Zones (Red Boxes)
There are two clear red boxes overhead. These have previously acted as strong rejection points. If price approaches these zones again, I’ll be cautious.
A breakout alone means nothing. I need a proper retest with volume before looking for continuation. Otherwise, these red boxes are prime short watch zones — especially if the market shows weakness on LTFs.
🧠 Final Thoughts
The levels I share aren’t random. They’re drawn from real activity, using the kind of tools most traders overlook. That’s why they work.
If DOGE gives a setup, I’ll act. If not, I’ll wait. That’s the edge — knowing when not to trade.
Let the market come to you.
📌I keep my charts clean and simple because I believe clarity leads to better decisions.
📌My approach is built on years of experience and a solid track record. I don’t claim to know it all but I’m confident in my ability to spot high-probability setups.
📌If you would like to learn how to use the heatmap, cumulative volume delta and volume footprint techniques that I use below to determine very accurate demand regions, you can send me a private message. I help anyone who wants it completely free of charge.
🔑I have a long list of my proven technique below:
🎯 ZENUSDT.P: Patience & Profitability | %230 Reaction from the Sniper Entry
🐶 DOGEUSDT.P: Next Move
🎨 RENDERUSDT.P: Opportunity of the Month
💎 ETHUSDT.P: Where to Retrace
🟢 BNBUSDT.P: Potential Surge
📊 BTC Dominance: Reaction Zone
🌊 WAVESUSDT.P: Demand Zone Potential
🟣 UNIUSDT.P: Long-Term Trade
🔵 XRPUSDT.P: Entry Zones
🔗 LINKUSDT.P: Follow The River
📈 BTCUSDT.P: Two Key Demand Zones
🟩 POLUSDT: Bullish Momentum
🌟 PENDLEUSDT.P: Where Opportunity Meets Precision
🔥 BTCUSDT.P: Liquidation of Highly Leveraged Longs
🌊 SOLUSDT.P: SOL's Dip - Your Opportunity
🐸 1000PEPEUSDT.P: Prime Bounce Zone Unlocked
🚀 ETHUSDT.P: Set to Explode - Don't Miss This Game Changer
🤖 IQUSDT: Smart Plan
⚡️ PONDUSDT: A Trade Not Taken Is Better Than a Losing One
💼 STMXUSDT: 2 Buying Areas
🐢 TURBOUSDT: Buy Zones and Buyer Presence
🌍 ICPUSDT.P: Massive Upside Potential | Check the Trade Update For Seeing Results
🟠 IDEXUSDT: Spot Buy Area | %26 Profit if You Trade with MSB
📌 USUALUSDT: Buyers Are Active + %70 Profit in Total
🌟 FORTHUSDT: Sniper Entry +%26 Reaction
🐳 QKCUSDT: Sniper Entry +%57 Reaction
📊 BTC.D: Retest of Key Area Highly Likely
📊 XNOUSDT %80 Reaction with a Simple Blue Box!
📊 BELUSDT Amazing %120 Reaction!
I stopped adding to the list because it's kinda tiring to add 5-10 charts in every move but you can check my profile and see that it goes on..

dogeIm just seeing opportunities to go long on good value tokens.
None of this is financial advice, im just pointing out that if you are patient and know what you are looking for then the right times to trade are easy to spot.
my long strat has triggered

Long trade
15min TF overview
🐶 DOGEUSD – Buy-Side Trade
📅 Date: Thursday, 24th April 2025
🕣 Time: 8:30 AM (New York Time)
📍 Session: London AM
📊 Entry Timeframe: Lower TF 5min
Trade Parameters
Entry Price: 0.17342
Take Profit: 0.17984 (+3.70%)
Stop Loss: 0.17277 (–0.37%)
Risk-Reward Ratio (RR): 9.83
Reasoning Narrative
This DOGEUSD buy-side trade was entered during the London AM session, a time known for increased volume and impulsive price movements as European markets open. The trade was driven by a clear bullish structure shift on the intraday timeframe, following a short-term liquidity sweep below local lows.
5min TF entry


DOGE Unleashed: Breakout Hints at 173% Moon MissionDogecoin (DOGE/USDT) just broke out of a textbook falling wedge, setting the stage for a potential 173% rally. The breakout comes with rising volume and reclaimed support, pointing to a bullish trend reversal.
Technical Highlights:
Pattern: Falling Wedge (Bullish Reversal)
Breakout Zone: ~$0.18
Support Levels: $0.143 and $0.16
Target Price: ~$0.46
Risk/Reward: Attractive with tight stop below support
Fundamental Fuel:
On-Chain Growth: Rising active wallets and transaction count
Adoption Narrative: DOGE remains a key player for micro-payments and tipping, often backed by Elon Musk's endorsements
Market Sentiment: Meme coin season brewing again as Bitcoin stabilizes and altcoins gain traction
Social Buzz: DOGE continues to trend on crypto forums and social media—momentum is building
If bulls hold this level, DOGE could be gearing up for its next major move. Keep an eye on volume and broader market sentiment.

S3LL TO LONGMarket have a liquidity and displacement to fill' I'm taking a sell now and my buy limit is set

Doge: Short-Term Trading OpportunityDoge: Short-Term Trading Opportunity
Over the past three days, starting April 14, Dogecoin (DOGE) has been in a clear bearish wave. However, the likelihood is high that this downturn was merely a correction before DOGE initiates another bullish surge.
On the 60-minute chart, the price has already broken out from the wedge pattern, suggesting a potential upward movement in the coming days. A short-term correction near $0.1550 is possible before the price resumes its ascent.
Key Resistance Areas:
$0.1607
$0.1670
You may find more details in the chart!
Thank you and Good Luck!
❤️PS: Please support with a like or comment if you find this analysis useful for your trading day❤️

DOGE USDT LONG TRADE SETUPDOGE is currently holding at a strong support level , with a high probability of a bounce. Additionally, other indicators, such as the 200 EMA , are also providing support, further increasing the likelihood of an upward move.
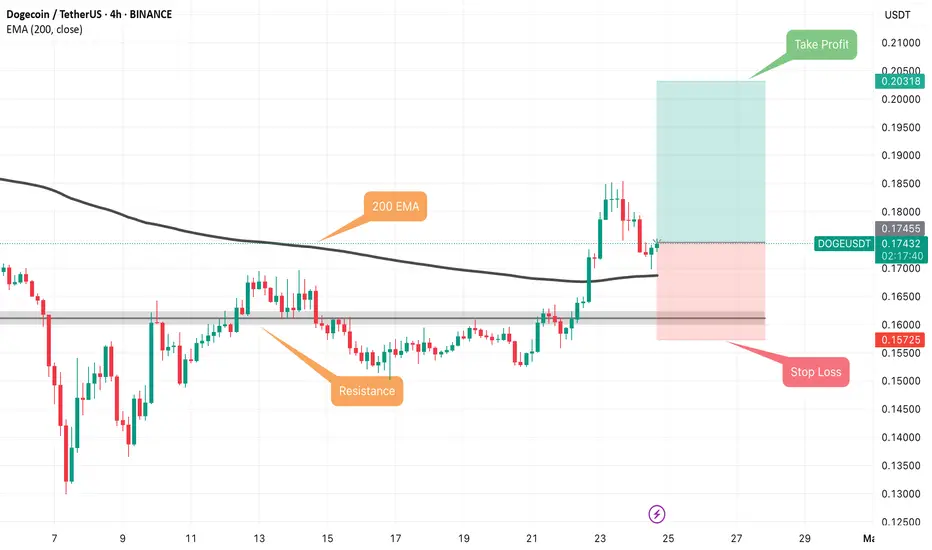
Crypto - Dogecoin - Wyckoff Accumulation LPSDogecoin is completing a wyckoff accumulation. It is at the LPS step. So we expect it to run up to the SOS step. We have a hammer candle at the bottom of a retrace which is bullish.
STO appears to have bottomed at 50 and is ready to run.
RSI has turned at 59 which means buyers are in control.
Price is 0.1740
Target 1 is 0.20 which is 15% without leverage.
Stop Loss should be around 0.164 so 6% max loss.

Doge Long : Falling Wedge Breakout?Looks like DOGE price has broken out of the falling wedge.
Found support at 4HR demand zone. Possible rally can begin from here.

doge buy midterm "🌟 Welcome to Golden Candle! 🌟
We're a team of 📈 passionate traders 📉 who love sharing our 🔍 technical analysis insights 🔎 with the TradingView community. 🌎
Our goal is to provide 💡 valuable perspectives 💡 on market trends and patterns, but 🚫 please note that our analyses are not intended as buy or sell recommendations. 🚫
Instead, they reflect our own 💭 personal attitudes and thoughts. 💭
Follow along and 📚 learn 📚 from our analyses! 📊💡"

DOGE SHORT TERMIf the uptrend continues and we see a bullish Total chart (i.e. we get volume support) then this pose will work.

Is DOGE Ready to Explode? Daily 1D Analysis with a 100% BullishThe overall power and main direction of Dogecoin is bullish. A healthy correction has recently occurred on the chart, and a 3D (three drives pattern) has been observed at the bottom, suggesting that sellers and those holding sell/short positions are currently exiting the market.
From the demand zone, we expect the price to move toward the specified targets.
A daily candle closing below the invalidation level would invalidate this analysis
Do not enter the position without capital management and stop setting
Comment if you have any questions
thank you

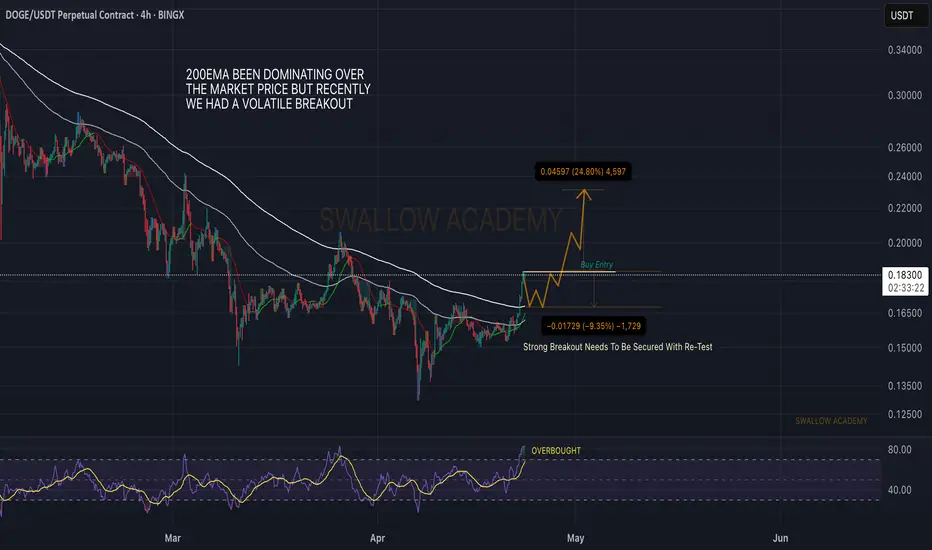
Doge Coin (DOGE): We Need To Re-Test 200EMA | Possible 10% MoveDogecoin had recently broken from the 200EMA trend holder, which had been dominating over the price for quite some time now.
With recent moves, RSI was also led into the overbought zones, which is giving us a chance to catch a smaller short position (once we see a proper MSB on smaller timeframes).
If all goes well, buyers should overtake that dominance at 200 EMA with a successful retest, and then we might see another movement to upper zones!
Swallow Team
DOGEUSDT - Now (Big Time) Bullish? Top Cryptocurrencies other than Bitcoin have been given a tough wrap over the last decade, pumping and dumping...but is that all about to change?
Significant funds have flowed into popular alt coins over the past few days...Is this in preparation of more sustained gains in popular secondary cryptocurrencies such as DOGE, ADA, LINK etc? Or will alt coins continue with their typical pump and dump style behaviour?
Time will tell...
We have identified a potential opportunity within DOGE over the coming weeks(+), caution as always is warranted.
We're inspired to bring you the latest developments across worldwide markets, helping you look in the right place, at the right time.
Thank you for reading! Stay tuned for further updates, and we look forward to being of service along your trading & investing journey...
Disclaimer: Please note all information contained within this post and all other Bullfinder-official Tradingview content is strictly for informational purposes only and is not intended to be investment advice. Please DYOR & Consult your licensed financial advisors before acting on any information contained within this post.

DOGECOIN - Time to buy again!Perhaps this is a cup and handle pattern, and if that's the case, it could push the price up to around 90 cents.
Give me some energy !!
✨We spend hours finding potential opportunities and writing useful ideas, we would be happy if you support us.
Best regards CobraVanguard.💚
_ _ _ _ __ _ _ _ _ _ _ _ _ _ _ _ _ _ _ _ _ _ _ _ _ _ _ _ _ _ _ _
✅Thank you, and for more ideas, hit ❤️Like❤️ and 🌟Follow🌟!
⚠️Things can change...
The markets are always changing and even with all these signals, the market changes tend to be strong and fast!!

NOTHING !!DOGE managed to break this triangle, but it can't yet be said that the price is bullish unless a few more candles closed above the triangle, and then it can be say that the price is bullish.
Give me some energy !!
✨We spend hours finding potential opportunities and writing useful ideas, we would be happy if you support us.
Best regards CobraVanguard.💚
_ _ _ _ __ _ _ _ _ _ _ _ _ _ _ _ _ _ _ _ _ _ _ _ _ _ _ _ _ _ _ _
✅Thank you, and for more ideas, hit ❤️Like❤️ and 🌟Follow🌟!
⚠️Things can change...
The markets are always changing and even with all these signals, the market changes tend to be strong and fast!!

Dogecoin 🚨 Dogecoin at a turning point!
💰 Price is hovering around 0.15842 dollars, moving within a symmetrical triangle. Right at the intersection of dynamic resistance and a descending trendline 📉. A breakout above 0.16643 dollars could pave the way for a rally toward 0.17830 and even 0.19401 dollars 🚀
But if sellers take control and price gets rejected 🔻, supports at 0.14632 and 0.13850 dollars come into play. Further pressure could push it down to the key support at 0.12980 dollars.
📊 With tightening price action and approaching the triangle’s apex, a breakout in the coming days seems likely. The big question: who’s in charge — buyers or sellers? 🤔
📈 Breaking 0.16643 = buyer strength
📉 Rejection = seller dominance

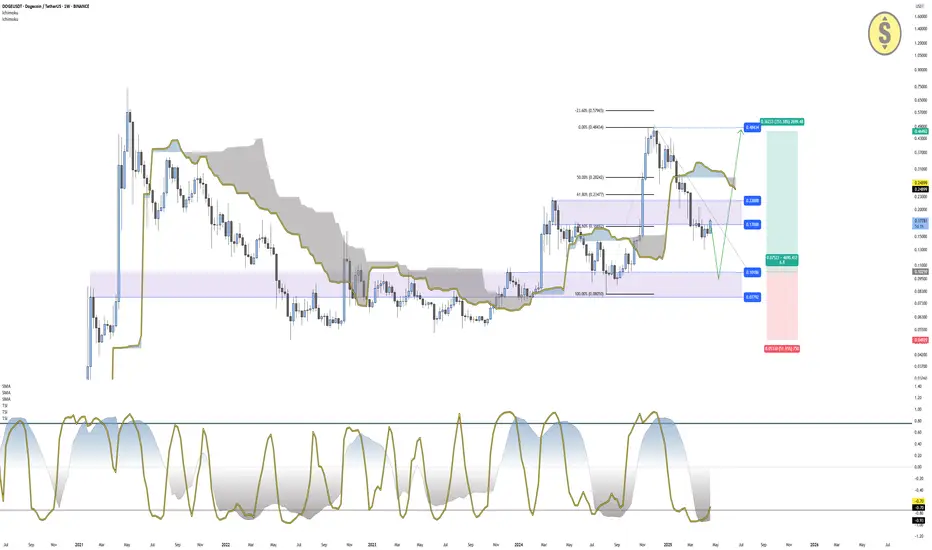
DOGE Weekly Outlook – Long Entry Zones Between 0.10 and 0.07Dogecoin is currently trading around $0.178, after completing a significant retracement of more than 61.8% from the recent rally, suggesting a potential end-of-correction scenario. Price is currently below the Ichimoku cloud (Span A at $0.248, Span B at $0.282), reflecting a short-term bearish context, though longer-term structure remains potentially bullish.
The Trend Strength Index (TSI) indicators are both in oversold territory:
TSI(10): -0.91
TSI(20): -0.93
Historically, these levels on the TSI have often preceded strong reversals during uptrends or after deep corrections.
A break and close above $0.22 would confirm bullish continuation, suggesting that DOGE may be ready to target higher zones, particularly $0.48–0.57, aligning with the 0.0% and -23.6% Fibonacci extension levels.
However, if price fails to break above $0.22, the ideal long entry zone lies between $0.10 and $0.07, a historical high-volume support range, where previous accumulation occurred. A bullish reaction from this zone with renewed TSI momentum could provide one of the best risk-reward setups on this chart.
Trade Setup Summary:
Breakout Confirmation: Above $0.22
Buy Zone (if pullback deepens): $0.10 – $0.07
Targets: $0.48 – $0.57 (prior highs and extension)
Invalidation: Close below $0.07
TSI: Deeply oversold – signaling potential for trend reactivation
DOGE continues to trade as a sentiment-driven asset, often tied to broader crypto momentum and social/institutional interest. While lacking strong fundamentals compared to large-cap projects, it benefits from speculative cycles and has historically seen rapid price expansion after corrections. With Bitcoin stabilizing and broader altcoin interest returning, a technical breakout on DOGE could attract strong inflows, particularly above the $0.22 level.
Disclaimer: This content is for educational and informational purposes only. It does not represent financial advice or a recommendation to buy or sell any financial instrument. Trading involves risk, and you should only trade with money you can afford to lose.
Important support and resistance zone: 0.18951-0.21409
Hello, traders.
If you "Follow", you can always get new information quickly.
Please click "Boost" as well.
Have a nice day today.
-------------------------------------
(DOGEUSDT 1D chart)
The M-Signal indicator on the 1M chart is passing the HA-Low indicator.
Therefore, the A section, that is, the area around 0.18951, is an important support and resistance zone.
-
However, since the HA-High indicator on the 1M chart is formed at the 0.21409 point, it is expected that the uptrend will begin only if the price rises above this point and maintains.
Therefore, we recommend buying when it shows support in the 0.18951-0.21409 range.
-
It is not visible on the current chart, but the HA-High indicator on the 1D chart is formed at the 0.42847 point.
Therefore, if it continues to rise like this, it is possible that it will touch the 0.42847 area.
If not, we should pay attention to whether the HA-High indicator on the 1D chart is newly created.
-
If it does not rise but falls, we should check whether it can rise with support near the M-Signal indicator on the 1D chart.
-
Thank you for reading to the end.
I hope you have a successful trade.
--------------------------------------------------
- This is an explanation of the big picture.
I used TradingView's INDEX chart to check the entire range of BTC.
I rewrote the previous chart to update it by touching the Fibonacci ratio range of 1.902 (101875.70) ~ 2 (106275.10).
(Previous BTCUSD 12M chart)
Looking at the big picture, it seems to have been following a pattern since 2015 and has been rising.
In other words, it is a pattern that maintains a 3-year uptrend and faces a 1-year downtrend.
Accordingly, the uptrend is expected to continue until 2025.
-
(Current BTCUSD 12M chart)
Based on the currently written Fibonacci ratio, it shows up to 3.618 (178910.15).
Fibonacci ratio 0.618 (44234.54) is not expected to fall again.
(BTCUSDT 12M chart)
I think it is around 42283.58 when looking at the BTCUSDT chart.
-
I will explain it again with the BTCUSD chart.
The Fibonacci ratio ranges marked in the light green boxes, 1.902 (101875.70) ~ 2 (106275.10) and 3 (151166.97) ~ 3.14 (157451.83), are expected to be important support and resistance ranges.
In other words, it seems likely to act as a volume profile range.
Therefore, in order to break through this section upward, I think the point to watch is whether it can rise with support near the Fibonacci ratios of 1.618 (89126.41) and 2.618 (134018.28).
Therefore, the maximum rising section in 2025 is expected to be the 3 (151166.97) ~ 3.14 (157451.83) section.
To do that, we need to look at whether it can rise with support near 2.618 (134018.28).
If it falls after the bull market in 2025, we don't know how far it will fall, but considering the previous decline, we expect it to fall by about -60% to -70%.
So, if the decline starts near the Fibonacci ratio 3.14 (157451.83), it seems likely that it will fall to around Fibonacci 0.618 (44234.54).
I will explain more details when the downtrend starts.
------------------------------------------------------
