DOGECOIN ( 0.55$ ) is uploading Hello and greetings to all the crypto enthusiasts, ✌
In several of my previous analyses, I have accurately identified and hit all of the gain targets. In this analysis, I aim to provide you with a comprehensive overview of the future price potential for Dogecoin, 📚💣
We are likely to witness a 37% rise in the coin’s price soon, though short-term bearish movements or consolidation phases could occur before the major uptrend. These patterns are often seen before a significant surge. 💡🙌
To better manage these fluctuations, I’ve highlighted key support levels using Fibonacci retracements. Recently, the coin surpassed several long-standing resistance levels, signaling an important shift. 💡📚
This is a key development, as the coin gains momentum with higher trading volumes and growing social media influence. 💡🎇
🧨 Our team's main opinion is The coin is poised for a 37% price increase, despite potential short-term fluctuations, as it gains momentum with key support levels and increasing market influence.🧨
Thank you for your attention. If you have any questions or comments, I’m here to respond to you. 🐋💡
DOGEUSDT.PS trade ideas

Doge passed a dollarThis is right before doge really starts to go ballistic as it has been cycle after cycle. Looks similar to the 21' Fractal.

Nothing has Changed we are Still going UpThere was a huge retracement Price has recovered its previous high and now sits on a support level. Expecting a rapid increase soon

WajaniTV AnalysisStructures 1-4 maintained,with market making HH and HL. I see big move bull move. Enter trade accordingly. However, every trade is risky and this is not a finacial advise.
Let me know your thoughts.
Thank you.

3 Coins About To Break Out MartyBoots here , I have been trading for 17 years and sharing my thoughts on 3 strong ALT Coins.
These ALTs are looking very strong, good charts for more upside
Do not miss out on these as this is a great opportunity
Watch videos for more details

Dogecoin $DOGE/USDT - 200D SMA Bull Regime DetectionThis indicator helps traders identify market regimes using the powerful combination of 50 and 200 SMAs. It provides clear visual signals and detailed metrics for trend-following strategies.
We've just had our bull regime print and are trading 43 days of bull regime duration.
Key Features:
- Dual SMA System (50/200) for regime identification
- Colour-coded candles for easy trend visualisation
- Metrics dashboard
Core Signals:
- Bullish Regime: Price > 200 SMA
- Bearish Regime: Price < 200 SMA
- Additional confirmation: 50 SMA Cross-over or Cross-under (golden cross or death cross)

They're EATING THE DOGE!!! (Short)Expecting dump here . Losing levels and forming LHs and LLs on low timeframe. On higher timeframe, are inside the 0.5-0.618 of the larger downward leg. Have already violently rejected the 0.382 which became that nasty bulltrap wick earlier in the week. Expectation is rejection here and bleed out. Targeting mid 30s for the time being, with an eventual loss leading to $0.29s.
Be conscious of the run & gun stop-hunt move as an alternative attractive route. Both would provide ample opportunity for offers.
Healthy 40% pullback after doing >200% in November.

DOGECOINLets check the 0.4 basis of Dogecoin and estimate the upward possible movement of price with demand accumulation .

DOGE Getting Ready to MOVE Talked about #DOGE today
Setup Provided with when to
enter and how to scale into the trade
Market Cap 59.6B
Setup provided with tight stop loss about 6%
The alert went off and we re-evaluated setup before we entered
Not Financial Advise


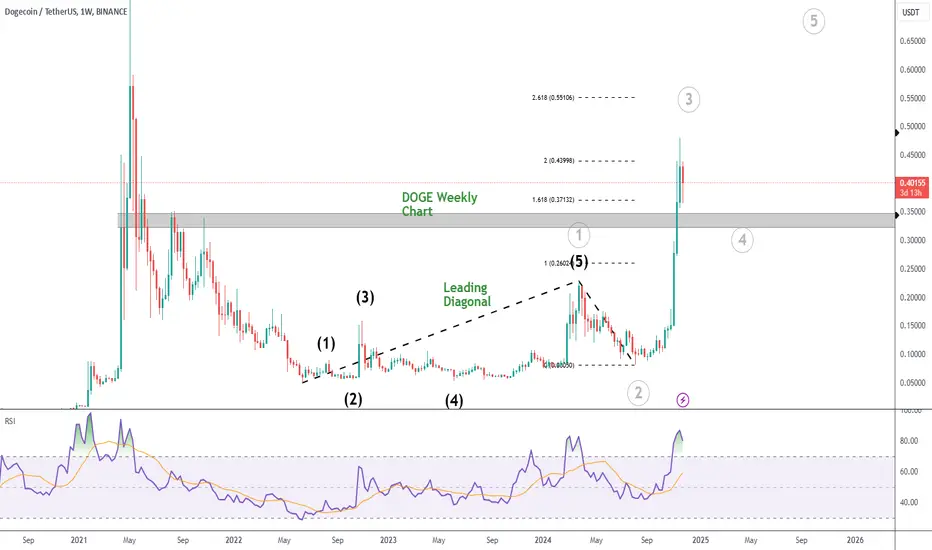
DOGE Weekly Chart
After a leading diagonal for gray 1, price pumped and we should soon see the end of gray 3.
Pullbacks for gray 4 are buying opportunities.
The zone just below 0.35 is a solid support area, which could give is a target for wave 4.
Dogecoin currency analysisDogecoin shows a bullish flag pattern in the 4-hour time frame, which can be bullish
Please observe the limit of profit and limit of loss. This is a personal analysis

DOGEUSDT more pump ahead soon we may have short-term fall or correction and then more pump to next targets which are 0.7$.
also remember market here is extremely bullish so we may have heavy pump without short-term fall to our target.
DISCLAIMER: ((trade based on your own decision))
<

Dogecoin on the Verge of a Breakout - Is the Hype Real?🐕💡 Dogecoin on the Verge of a Breakout - Is the Hype Real? 🌐📈
Dogecoin (DOGE) has entered the spotlight again, with both its chart structure and community-driven narrative gaining traction. From Elon Musk’s playful endorsement to broader market trends, let’s analyze the technical and fundamental drivers propelling DOGE forward.
Technical Breakdown
Key Levels to Watch:
Support: DOGE holds steady above $0.38, with critical reinforcement at $0.32.
Resistance: The immediate challenge lies at $0.44, a breakout of which could lead to the psychological $0.69 level.
Bullish Chart Structure:
A triangular pattern signals tightening price action, hinting at a significant move.
Volume is rising, with strong open interest and spot volume support, further reinforcing bullish sentiment.
Indicators of Momentum:
Funding rates remain neutral, minimizing liquidation risk from excessive leverage.
Aggregate open interest shows steady growth, indicating robust participation.
Beyond the Charts - Dogecoin’s Unique Catalyst
The recent satirical commentary connecting Dogecoin to Elon Musk’s “Department of Government Efficiency” adds a unique twist to DOGE’s narrative. Whether satire or inspiration, the community buzz drives attention and speculation, adding fuel to the current rally.
Takeaway: Love it or hate it, DOGE thrives on sentiment, and such narratives only strengthen its core appeal.
Outlook
DOGE is poised for a breakout if it clears $0.44, with an eye toward $0.69. However, traders should stay cautious below the $0.38 support level as it may signal retracement.
Pro-Tip: Watch both Technical and sentiment indicators, as they’re pivotal in Dogecoin’s unique trajectory.
One Love,
The FXPROFESSOR 💙
ps. I will be Long over 0.384 and Short under that level... You see, Elon has 10 children and Doge could end up being his 'Xmas gift for his Kids'' Department...just saying

DogeusdtI still have eyes on Dogecoin, with this obvious continuation pattern, lower TF gave good entry vibe already lets see what HTF does... Fingers crossed

DogecoinDodge is pulling back to a higher supply area after reacting to a low time demand area, which is expected to hit the specified supply area until the strong demand area drops below and then has a stronger upward movement.

Dogecoin (DOGE): Short-Term = SELL / Mid-Term = BUYDogecoin is back with a huge upward movement it made recently, towards the ATH zone.
Not that we had some kind of bullish momentum; we see that buyers have stopped the pushing here and sellers are slowly showing dominance (based on the candles and liqudidy).
So we are here with 2 plans:
1) We want to see a market structure break, which would result in a good, healthy correction towards the unfilled CME gap (which would then result in a good buying opportunity).
2) We break current liquidity zones and go for another bullish movement here!
Swallow Team

DOGE LONG - ATH Possibly at play...Clear change in direction on the hourly and 15m time periods, showing a potential upside.
On the hourly, hitting Resistance, I think we need to flip this, for continuation of a bullish movement.
Once this is broken, I think we will continue up possibly reaching for previous ATH.
On the 4H Timeframe, you can see we are skirting the .618 Fib Speed fan, also confirming more upside to come. Doge seems to be respecting the fib speed fan quite well.

Doge/USDT Short TradeThere is still room for Doge to go lower. PoC acting as resistance is a good confirmation.
Entry level is around PoC of Doge
Stop Loss level right above previous high or above PoC
TP level will be around VaL of Doge


Dogecoin Next Big Move: Key Zones to WatchThe chart depicts the price action of Dogecoin (DOGE) against Tether (USDT) in the 4-hour timeframe, highlighting potential zones of support and resistance. The two blue horizontal zones represent key support areas, where buyers might step in to halt the price decline and potentially trigger a rebound. The black zigzag lines illustrate speculative pathways, indicating potential scenarios where the price could consolidate within these zones before resuming an upward movement or breaking lower.
The upper resistance level around $0.438 serves as a key area to watch for potential rejection or breakout. The price is currently around $0.385 and appears to be heading toward the first support zone between $0.34036 and $0.35339. A potential double bottom or bullish reversal is anticipated within these zones, with arrows pointing to a possible upward movement. Traders could monitor price reactions in these areas to validate the direction, keeping an eye on volume to confirm bullish or bearish momentum.

PEPECOIN/USD & DOGE/USDI thought there were some striking similarities between Pepecoin when compared with Dogecoin
Firstly, note the timescale difference between the two - Pepecoin is on a Daily timeframe whilst Dogecoin is on the Weekly timeframe
The initial move served as an area of support for DOGE, and you can see that price eventually wicked below the point of impulse while also printing a Higher Low. The yellow box served as an excellent area to bid Dogecoin before it rallied 500% in following months
You can also see some similarities in RSI structure (circled)
I have taken a fractal from the recent spike in Dogecoin and overlayed it on the Pepecoin chart to give a rough idea of how it might play out
I do think the yellow box will prove to be an excellent entry on Pepecoin - anywhere from $2.80 down to $2.30, with an invalidation below $2.11
If a 500% were to follow it would put Pepecoin around $14 by EOY
