Doge: Balancing Hype and RealityDogecoin is currently trading at $0.1464, reflecting a modest 0.11% increase over the past 24 hours. This slight uptick contrasts with the broader cryptocurrency market, which has declined by 4.4% in the same period, showcasing Dogecoin’s relative resilience among altcoins. However, it remains far from its all-time high of $0.7376 (reached in May 2021). Some users point to whale accumulation as a bullish sign, while others flag bearish risks tied to macroeconomic factors, such as U.S. inflation data and Federal Reserve policy shifts.
Broader Context: Dogecoin’s Unique Position
Unlike many cryptocurrencies with defined utility, Dogecoin’s value is driven largely by its meme status and vibrant community. This makes it highly reactive to social media trends and influencer endorsements, think Elon Musk or other high-profile figures. Recent chatter on the internet about whale activity suggests big players might be accumulating or offloading, which could foreshadow significant price shifts. However, its speculative nature leaves it exposed during broader market downturns, as seen in today’s risk-off environment. For Dogecoin to sustain momentum, it relies heavily on ongoing community engagement and real-world adoption, such as its use by merchants like the Dallas Mavericks.
Potential Scenarios
Bullish Case: If $0.14 support holds and $0.15 is breached with strong volume, Dogecoin could climb to $0.16 in the short term, potentially reaching $0.20 longer term if community hype or positive news (e.g., Elon Musk tweets) kicks in.
Bearish Case: A drop below $0.14 might test $0.13, with further declines to $0.10 possible if selling pressure intensifies.
Historical Patterns and What’s Next
Looking back, Dogecoin has a history of explosive rallies followed by steep corrections, its 2021 surge to $0.7376 was fueled by retail mania and celebrity hype, only to crash as momentum faded. Today’s price action at $0.1464 feels more subdued, but the potential for a breakout (or breakdown) remains. If whale accumulation continues and sentiment flips bullish, a revisit to $0.20 or higher isn’t out of the question. On the flip side, a broader crypto sell-off could push it toward $0.08 support. Patience is key, wait for confirmation via volume or a catalyst before jumping in.
DOGEUSDT.PS trade ideas

DOGE is approaching my POI, where we can look for spot/longs DOGE is quickly approaching the 3D HOB at 0.12 and 2M Demand at 0.15, which would be a fantastic RR opportunity if in confluence with BTC and TOTAL.
All the information, such as TP, short, and supply, is provided in the chart.
Mark those key levels and keep an eye on them :)

Can Dogecoin hold or is a $0.14 retest coming?Hello and greetings to all the crypto enthusiasts, ✌
All previous targets were nailed ✅! Now, let’s dive into a full analysis of the upcoming price potential for Dogecoin 🔍📈.
Dogecoin is currently trading within a descending channel and has reached its upper resistance level. Based on technical analysis, a potential 17% decline is anticipated, bringing the price toward the mid-range of the channel. Following this movement, a retest of the $0.14 level—our primary target—remains a key scenario to watch.📚🙌
🧨 Our team's main opinion is: 🧨
Dogecoin is at the top of a falling channel, and a 17% drop to the mid-level, with a retest of $0.14 as the main target, seems likely.📚🎇
Give me some energy !!
✨We invest hours crafting valuable ideas, and your support means everything—feel free to ask questions in the comments! 😊💬
Cheers, Mad Whale. 🐋

DOGEUSDT Quick Insight: Short-Term Sell Signal ActivatedBased on the latest EASY Trading AI strategy analysis, DOGEUSDT shows a clear short-term Sell signal. Enter at 0.16898, targeting a Take Profit at 0.16615 with a protective Stop Loss positioned at 0.17175.The forecast emerged after the AI identified weakening bullish momentum and increased selling pressure near crucial resistance levels. Technical indicators suggest a high probability of a corrective move downward, aligning with current bearish sentiment in short-term analysis.Trade responsibly, sticking precisely to the listed parameters.

Short trade
Trade Breakdown – Sell-Side (Crypto Weekend Setup)
📅 Date: Saturday, April 5, 2025
⏰ Time: 3:00 PM NY Time (NY Session PM)
📉 Pair: DOGE/USD
📉 Trade Direction: Short (Sell)
Trade Parameters:
Entry Price: 0.16821
Take Profit (TP): 0.16173 (+3.85%)
Stop Loss (SL): 0.17009 (-1.12%)
Risk-Reward Ratio (RR): 3.45
Reasoning:
Demand Turned to Resistance" — this signals a bearish shift in structure:
I assume a likely failed rally, where previous demand could not hold for confirmation bias
and price seemed to respect the demand zone (highlighted blue) as resistance, giving confluence for a short. Targeting a pivotal low, suggesting a liquidity grab or structure retest.

"DogeCoin vs Tether" Crypto Market Heist Plan (Swing / Day)🌟Hi! Hola! Ola! Bonjour! Hallo! Marhaba!🌟
Dear Money Makers & Robbers, 🤑 💰💸✈️
Based on 🔥Thief Trading style technical and fundamental analysis🔥, here is our master plan to heist the DOGE/USDT "DogeCoin vs Tether" Crypto Market. Please adhere to the strategy I've outlined in the chart, which emphasizes long entry. Our aim is the high-risk Red Zone. Risky level, overbought market, consolidation, trend reversal, trap at the level where traders and bearish robbers are stronger. 🏆💸"Take profit and treat yourself, traders. You deserve it!💪🏆🎉
Entry 📈 : "The vault is wide open! Swipe the Bullish loot at any price - the heist is on!
however I advise to Place buy limit orders within a 15 or 30 minute timeframe most recent or swing, low or high level. I Highly recommended you to put alert in your chart.
Stop Loss 🛑:
Thief SL placed at the recent/swing low level Using the 2H timeframe (0.16000) Day trade basis.
SL is based on your risk of the trade, lot size and how many multiple orders you have to take.
🏴☠️Target 🎯: 0.22000 (or) Escape Before the Target
🧲Scalpers, take note 👀 : only scalp on the Long side. If you have a lot of money, you can go straight away; if not, you can join swing traders and carry out the robbery plan. Use trailing SL to safeguard your money 💰.
DOGE/USDT "DogeCoin vs Tether" Crypto Market Heist Plan (Swing / Day Trade) is currently experiencing a bullishness,., driven by several key factors.
📰🗞️Get & Read the Fundamental, Macro, COT Report, On Chain Analysis, Sentimental Outlook, Intermarket Analysis, Future trend targets.. go ahead to check 👉👉👉
⚠️Trading Alert : News Releases and Position Management 📰 🗞️ 🚫🚏
As a reminder, news releases can have a significant impact on market prices and volatility. To minimize potential losses and protect your running positions,
we recommend the following:
Avoid taking new trades during news releases
Use trailing stop-loss orders to protect your running positions and lock in profits
💖Supporting our robbery plan 💥Hit the Boost Button💥 will enable us to effortlessly make and steal money 💰💵. Boost the strength of our robbery team. Every day in this market make money with ease by using the Thief Trading Style.🏆💪🤝❤️🎉🚀
I'll see you soon with another heist plan, so stay tuned 🤑🐱👤🤗🤩

#DOGE/USDT Update📊 #DOGE/USDT Update 📊
🚀 CRYPTOCAP:DOGE just broke the Daily Diagonal Trendline!
✅ Yesterday’s Daily Candle closed bullish — signs of strength showing up!
🔼 Local Resistance: PWH $0.2057
🔽 Support Zone: PML $0.1428
If we bounce here, it could be massive. Eyes on #DOGEUSDT!

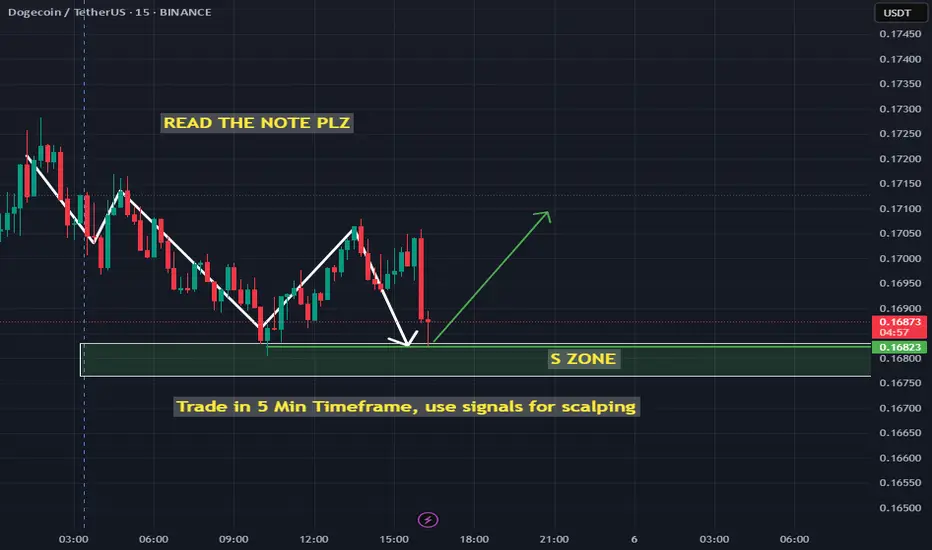
DOGEUDST NEXT MOVESell after bearish candle stick pattern, buy after bullish candle stick pattern....
Best bullish pattern , engulfing candle or green hammer
Best bearish pattern , engulfing candle or red shooting star
NOTE: IF YOU CAN'T SEE ANY OF TOP PATTERN IN THE ZONE DO NOT ENTER
Stop lost before pattern
R/R %1/%3
Trade in 5 Min Timeframe, use signals for scalping
DOGE SHORT $DOGE CRYPTOCAP:DOGE 30m short
The short-term bias is bearish.
A test of the designated zone of interest (POI) may provide optimal conditions for a short entry.
Targets: $0.16623, $0.16466, $0.16300, $0.15991.

DOGE/USTDTF30, if it breaks 0.17282, targets for a rise are 0.17499 - 0.17959, and it must not fall below the low of 0.15998.

The key is whether it can rise to around 0.18951
Hello, traders.
If you "Follow", you can always get new information quickly.
Please click "Boost" as well.
Have a nice day today.
-------------------------------------
(DOGEUSDT 1D chart)
Most coins (tokens) are below the M-Signal indicator on the 1D chart.
In order to turn into a short-term uptrend, the price must be maintained above the M-Signal indicator on the 1D chart at least.
-
In order to continue the uptrend, the price must be maintained above the M-Signal indicator on the 1M chart.
Therefore, what we should be interested in is whether there is support around 0.18951.
Then, if it rises above 0.21409 and maintains the price, an uptrend is expected to begin.
-
If not and it falls, it is important to find support near 0.13377.
-
Thank you for reading to the end.
I hope you have a successful trade.
--------------------------------------------------
- Here is an explanation of the big picture.
I used TradingView's INDEX chart to check the entire range of BTC.
I rewrote the previous chart to update it while touching the Fibonacci ratio range of 1.902(101875.70) ~ 2(106275.10).
(Previous BTCUSD 12M chart)
Looking at the big picture, it seems to have been maintaining an uptrend following a pattern since 2015.
That is, it is a pattern that maintains a 3-year uptrend and faces a 1-year downtrend.
Accordingly, the uptrend is expected to continue until 2025.
-
(Current BTCUSD 12M chart)
Based on the currently written Fibonacci ratio, it is displayed up to 3.618 (178910.15).
It is expected that it will not fall again below the Fibonacci ratio of 0.618 (44234.54).
(BTCUSDT 12M chart)
Based on the BTCUSDT chart, I think it is around 42283.58.
-
I will explain it again with the BTCUSD chart.
The Fibonacci ratio ranges marked in the green boxes, 1.902 (101875.70) ~ 2 (106275.10) and 3 (151166.97) ~ 3.14 (157451.83), are expected to be important support and resistance ranges.
In other words, it seems likely that they will act as volume profile ranges.
Therefore, in order to break through these ranges upward, I think the point to watch is whether they can receive support and rise near the Fibonacci ratios of 1.618 (89126.41) and 2.618 (134018.28).
Therefore, the maximum rising range in 2025 is expected to be the 3 (151166.97) ~ 3.14 (157451.83) range.
In order to do that, we need to see if it is supported and rises near 2.618 (134018.28).
If it falls after the bull market in 2025, we don't know how far it will fall, but based on the previous decline, we expect it to fall by about -60% to -70%.
Therefore, if it starts to fall near the Fibonacci ratio 3.14 (157451.83), it seems likely that it will fall to around Fibonacci 0.618 (44234.54).
I will explain more details when the bear market starts.
------------------------------------------------------

DOGE Update1I expect DOGE goes down to 0.1580-0.1590 and bounce back. It is my assumption not a financial advice!
Current RSI Overview:
1-Hour RSI: Around 25-27, deep in the oversold zone.
4-Hour RSI: Below 10, extremely oversold, suggesting a potential bounce.
Daily RSI: Around 32-33, approaching oversold territory but not yet fully there.
Likelihood of a Drop Below $0.165:
Moderate Probability (~30-40%) – While RSI suggests a bounce is likely, there’s still a possibility of a quick dip to test stronger support below.
Higher Bounce Probability (~60-70%) – Given the oversold conditions and approaching support, a bounce toward the $0.172-$0.175 range is more likely in the short term.


DOGEUSDT from two major daily supports can pumpAs we can see two major daily supports now are ahead:
A. 0.135$
B. 0.090$
We are looking for rise and pump from these supports so we set our buy pending and still watching chart also remember because of breakout to the upside here pump may start sooner.
DISCLAIMER: ((trade based on your own decision))
<<press like👍 if you enjoy💚

DOGE I Weekly CLS, KL - 3M OB, Model 2, Target Range highHey Traders!!
Feel free to share your thoughts, charts, and questions in the comments below—I'm about fostering constructive, positive discussions!
🧩 What is CLS?
CLS represents the "smart money" across all markets. It brings together the capital from the largest investment and central banks, boasting a daily volume of over 6.5 trillion.
✅By understanding how CLS operates—its specific modes and timings—you gain a powerful edge with more precise entries and well-defined targets.
🛡️Follow me and take a closer look at Models 1 and 2.
These models are key to unlocking the market's potential and can guide you toward smarter trading decisions.
📍Remember, no strategy offers a 100%-win rate—trading is a journey of constant learning and improvement. While our approaches often yield strong profits, occasional setbacks are part of the process. Embrace every experience as an opportunity to refine your skills and grow.
I wish you continued success on your trading journey. May this educational post inspire you to become an even better trader!
“Adapt what is useful, reject what is useless, and add what is specifically your own.”
David Perk ⚔

DOGE/USDT:BUY...Hello dear friends
Given the price drop we had in the specified support range, considering the price growth indicates the entry of buyers.
Now, given the good support of buyers for the price, we can buy in steps with capital and risk management and move towards the specified goals.
*Trade safely with us*

Dogecoin (DOGE): Seeing Another 30% Drop Incoming Before PumpDogecoin is still dipping pretty well where we are now looking for BOS to form, which would give us a chance to get another 30% of market price movement to lower zones here.
More in-depth info is in the video—enjoy!
Swallow Academy

Short Position DOGE/USDT#Singal
DOGE/USDT
🔴 Short Position
🎲 Entry1 @ 0.17721
🎲 Entry2 @ 0.17950
✅ Target1@ 0.17526
✅ Target2 @ 0.17279
✅ Target3 @ 0.16852
✅ Target4 @ 0.16424
✅ Target5 @ 0.16005
❌ Stop Loss @ 0.18539
Leverage: 5X_15X
Margin: 10% of Wallet Balance
⚠️"Take Care of Risk Management for Your Account"

DOGE/USDT is a critical decision zone🧠 Technical Overview:
✅ 1. Price Action:
The price is forming a descending triangle pattern, which typically signals bearish continuation if broken to the downside.
It’s currently testing a key horizontal support zone around $0.164 – $0.18 USDT (marked in pink), a historical accumulation area.
Lower highs suggest sellers are still in control.
☁️ 2. Ichimoku Cloud:
Price is below the cloud, and both Tenkan and Kijun lines are pointing down → clear bearish trend.
No sign of bullish reversal from Ichimoku yet.
📉 3. RSI (14):
RSI is at 32.98, nearing the oversold region.
The RSI and its moving average are running close together, no strong divergence yet.
🔄 4. WTO (Wave Trend Oscillator):
WTO is deep in the oversold zone (around -50), and the blue and orange lines are slightly curling up → possible short-term bounce signal.
🔄 5. MACD:
The MACD histogram is shrinking on the negative side, showing bearish momentum is weakening.
However, MACD has not crossed above the signal line yet → wait for confirmation.
🧪 6. Cluster Algo:
No strong bullish signals yet from the cluster indicators.
Lines are compressing, which may indicate a potential breakout soon.
🔍 Key Levels:
Immediate Resistance: $0.20 – $0.21 USDT (Fib 0.236), further targets at $0.28 and $0.455 (Fib 0.786).
Critical Support: $0.164 USDT. If this breaks, price could head to $0.11 – $0.12 (previous lows).
🎯 Summary:
This is a critical decision zone – price is at the bottom of a descending triangle and testing strong support.
RSI + WTO are near oversold → a bounce is possible, but MACD confirmation is needed.
If support at $0.164 fails, price might drop sharply.
If it holds and volume picks up, a move toward $0.20 – $0.21 is likely.

Doge nutral So hello guys welcome to everyone . I share a idea about the trend but I do not give any advice to investment here only my purpose for learning . So research on your risk. Let's talk about the market
Dogeusdt is in 15 minutes channel and previous very strong bearish move about today market do not give a big move, reason the support is here . Very risky trade

LONG Position DOGE/USDT#Singal
DOGE/USDT
🟢 LONG Position
🎲 Entry1 @ 0.13210
✅ Target1@ 0.15662
✅ Target2 @ 0.18624
✅ Target3 @ 0.23616
✅ Target4 @ 0.30623
✅ Target5 @ 0.46684
❌ Stop Loss @ 0.09768
Leverage: 5X
Margin: 10% of Wallet Balance
⚠️"Take Care of Risk Management for Your Account"

DOGE bulls are taking back control soonboost and follow for more ❤️🔥
downtrend from late January is finally breaking, maybe a bit more consolidation before the next bullish rally though.
Watching for a break past .206, after that we get see a rally higher up to .30s short term 🎯

