Dogs—New Entry—Buy Now! Higher Low, Easy Profits (PP: 1513%)The retrace is in for Dogs and support is found exactly at the baseline of the initial bullish reversal and bottom pattern, the Adam & Eve.
Good evening my fellow Cryptocurrency trader, I hope you are having a wonderful day.
Have you been tracking Dogs?
Are you ready to trade?
Great opportunities

Dogs 4X Lev. Full PREMIUM Trade-Numbers (PP: 1608%)Dogs bottom is now confirmed and this is a chart setup with low risk vs a high potential for reward.
The bottom signal comes from a pattern, the breakdown of the downtrend, high volume after the first main low and current price action as well as marketwide action and Bitcoin being strong. These are

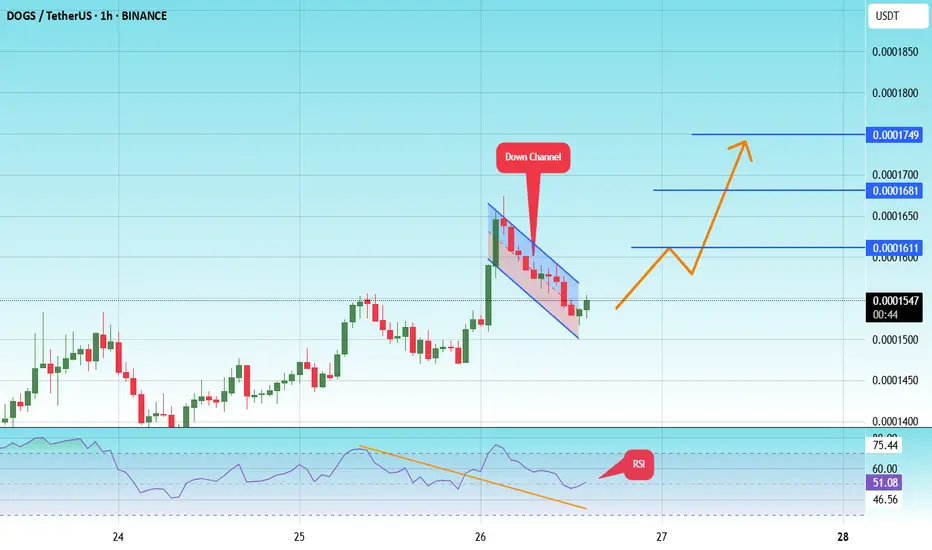
#DOGS/USDT#DOGS
The price is moving within a descending channel on the 1-hour frame, adhering well to it, and is on its way to breaking it strongly upwards and retesting it.
We are seeing a bounce from the lower boundary of the descending channel, this support at 0.0002050.
We have a downtrend on the RSI in

DOGSUSDT short positionDOGSUSDT short position
after a peak a volume and long shadow of a ascending candle the price will drop.
it's now appropriate for short position with at least RR=2

$DOGS/USDT Breakout alert📈 $DOGS/USDT Breakout Alert
DOGS just broke out of its long-term descending wedge — a bullish signal!
- Trendline cracked
- Support held
- Reversal brewing?
One to watch. DYOR!

#DOGS/USDT#DOGS
The price is moving within a descending channel on the 1-hour frame and is expected to break and continue upward.
We have a trend to stabilize above the 100 moving average once again.
We have a downtrend on the RSI indicator that supports the upward move with a breakout.
We have a support
dogsusdtat this moment with both of pressure and side of this pattern we can see short level until 0.0001414 level spacial 0.0001420 we can easily recive be patient have sl point about 8 point

#DOGS/USDT#DOGS
The price is moving within a descending channel on the 1-hour frame and is expected to continue lower.
We have a trend to stabilize below the 100 moving average once again.
We have a downtrend on the RSI indicator, supporting the upward move with a break above it.
We have a resistance area

#DOGS/USDT#DOGS
The price is moving in a descending channel on the 1-hour frame and is expected to continue upward.
We have a trend to stabilize above the 100 moving average once again.
We have a downtrend on the RSI indicator that supports the upward move with a breakout.
We have a support area at the lo

Analysis DOGS 1DTechnical analysis of the dogs on the 1-day timeframe, which is below the block order and above the blue dynamic support.

See all ideas
Summarizing what the indicators are suggesting.
Oscillators
Neutral
SellBuy
Strong sellStrong buy
Strong sellSellNeutralBuyStrong buy
Oscillators
Neutral
SellBuy
Strong sellStrong buy
Strong sellSellNeutralBuyStrong buy
Summary
Neutral
SellBuy
Strong sellStrong buy
Strong sellSellNeutralBuyStrong buy
Summary
Neutral
SellBuy
Strong sellStrong buy
Strong sellSellNeutralBuyStrong buy
Summary
Neutral
SellBuy
Strong sellStrong buy
Strong sellSellNeutralBuyStrong buy
Moving Averages
Neutral
SellBuy
Strong sellStrong buy
Strong sellSellNeutralBuyStrong buy
Moving Averages
Neutral
SellBuy
Strong sellStrong buy
Strong sellSellNeutralBuyStrong buy
Displays a symbol's price movements over previous years to identify recurring trends.