DOT Exchange Trading 21-12-12DOT has broken down out of the 50% level twice but the 61.8% seems to be holding pretty well on the daily. For that reason, I am only showing the relevant part of the chart in this image. It does not look like price is going to drop below the $26 level. It has been there twice in the past few days. However, we are looking for a higher high around 31.65 before I would consider buying.
DOTUSD.P trade ideas

Polkadot´s 5 tasks on the 4h chart (DOT)Polkadot´s 5 tasks on the 4h chart...
1. breakout of the resistances on RSI and OBV
2. flip the MA Ribbon bullish (green)
3. breakout of the red trendline channel
4. break the volume resistance
5. confirm breakout(s) and have fun 😎
Drop me a nice comment if you'd like me to analyze any other cryptocurrency or do another comparison.
*no financial advice
do your own research before investing

Polkadot head and shouldersI think this is fairly reasonable given the set-up.
Double bottom on daily RSI at 30ish.
50D MA coming down as resistance.
Symmetrical price levels for head & shoulders pattern.
Sell target $38, approximately 35% gains in a week or so, not too bad....

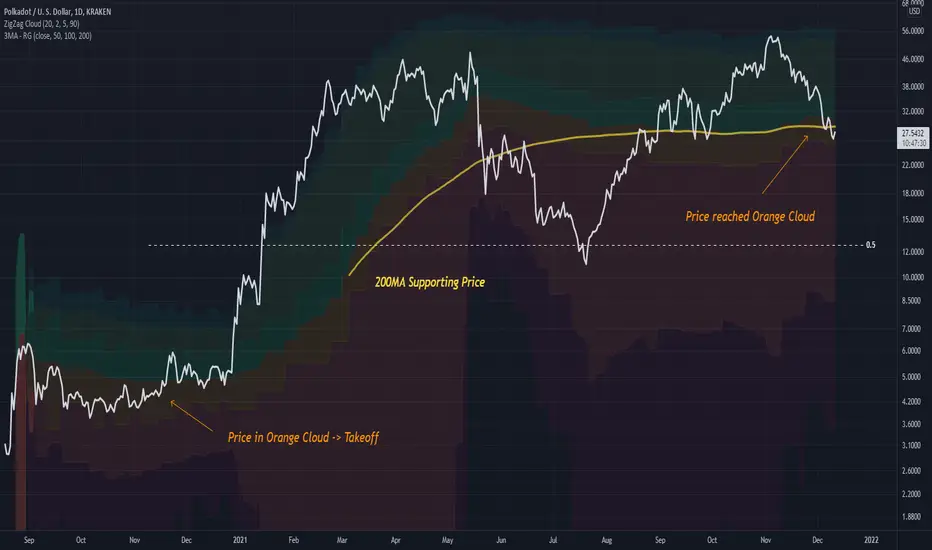
DOTUSD Analysis Using Cloud IndicatorUsing the cloud indicator we can see that prior point of being in the orange area price went lift off!
Assuming we are in a bullish state, (as price was then), the orange area is a good candidate point for price to continue upwards
This theory is also supported by the 200 day MA, which price is currently hanging onto right now.
Entry into DOTUSD now is a great decision if you are a believer in the project
I’m going all in, next stop… moon imo (not financial advice)The markets are bloody but according to trend analysis, it’s the bottom.

DOT maybe XMAS sales!Good Friday,
Just putting this out there. Hopefully this will not happen.
Many indicators would suggest we would lower.
A daily candle closing below the $26 line will lead to the "ball" area.
Why the "ball" area? Because you can pick up the ball there.
One positive thing is DOT rarely passed the oversold line on the daily and we are at that level now so we might be not crying after all.
We would suggest anybody to wait and see. Sometimes it is good to see things develop before taking any decision.
See you all soon!


dot swing ~the perma bears are excited today,
the media thinks the sky is falling,
and we, are just doing our thing.
swing dot from the local golden zone -> 100% extension for free moneys.
----
buy - $27.2
target - $34

DOT Polkadot: Next Leg Up PossibleQuick Analysis on Polkadot ( DOTUSD ) on a 1D Linear Chart:
1) An Arc line has been drawn for Polkadot as the price has been moving up the Arc.
2) From the first top price of about $51 to the next top price of about $55, there was an estimated 10% price increase. The estimated new All Time High for the price, assuming a 10% increase, would be around $61-$62.
3) The RSI (relative strength index) has the potential to go back up as it is currently hovering in the oversold region and with a possible double bottom pattern, it could move up quickly.
4) The Volume is heavy.
5) After this move upwards, the price may have the potential to go Parabolic!
What are your opinions on this?
If you enjoy my ideas, feel free to like it and drop in a comment. I love reading your comments below.
Disclosure: This is just my opinion and not any type of financial advice. I enjoy charting and discussing technical analysis . Don't trade based on my advice. Do your own research! #cryptopickk

Dumpadot.Large discounts coming for people who like to own an inflating pile of dots with no max supply, Don't worry though if enough people stake it what can possibly go wrong...infinite supply and infinite demand forever...yea good joke, I call it DILUSIONAL hence diluted.

Mid-term game plan on Polkadot.Expecting consolidation between 25.00 - 37.50 range.
50 % range seems like a good opportunitiy to trade.

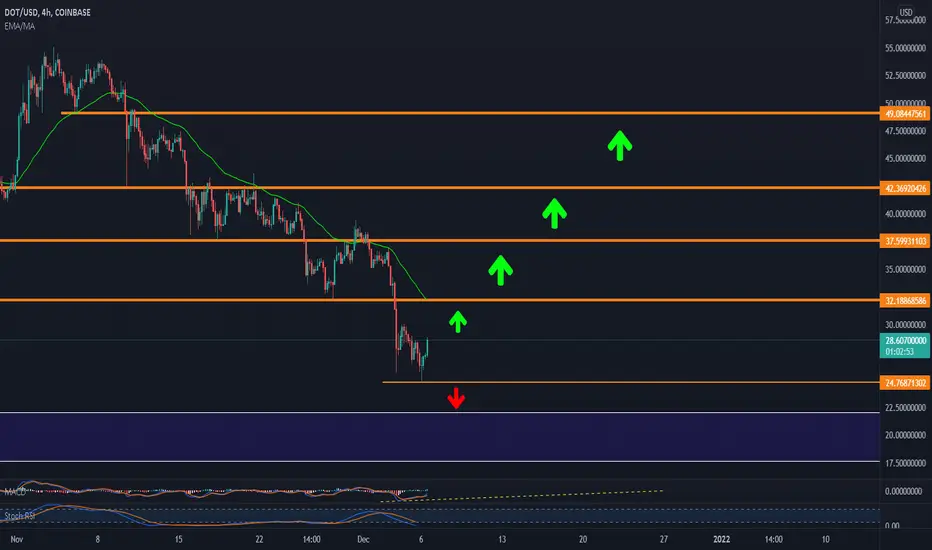
DOT - Support & Resistance LevelsSupport & Resistance Levels Laid Out.
UPT:
32.18
37.59
DPT:
24.76
22.0
Stoch RSI: Oversold Territory
Awaiting for market structure reversal prior to initiating a long position.
Waiting for high highs and higher lows to appear in the chart and for price to
trade above the 50EMA.
Price action is KING!
More power to all your trades, my friends!
Ron
Intrepid_Trader
POLKADOT IS BLEEDING - DOT USDDOT USD chart does not look good for POLKADOT. But the RSI shows it is oversold and we are also hiding pretty strong support. I expect the price to go higher at least to $32. YOU should not go all in until we break up the bearish TL.

DOT updateDot followed plan as expected, head and shoulder did break and its very close to the target now. More downside or a bounce soon!!

Polkadot back to the starting pointPolkadot is currently in a downtrend (weakening) but still in a downtrend, the next move of BTC will be decisive

Polkadot (DOTUSD) TESTING MAJOR SUPPORRT LEVEL!November was an awful month for DOT. Despite setting a new all-time high in early November, the price has been on a sharp downward trend. The sell-off escalated this week, where were saw price went from $40 to as low as $22!! Price broke the major support level, but quickly recovered. Now price is testing the major support level that starts at $28. Let's see if the price can end next week above $28! In that case, a bullish scenario is more likely. The major risk here is if price breaks below the final support level at 22.

DOT Exchange Trading 21-12-05DOT is just below the Daily 50-61.8% level which for me is a great place to look for an entry.

Polkadot heading up before its updatePolkadot has managed to go up with "not much" swings. The update is around the corner and the price action seems favorable to reach 88-92 Zone. Risk reward looks good, I have been accumulating since a month.


Polkadot price analysisThe Polkadot price analysis shows that after falling to the $35.00 level, DOT was unable to recover to $40.00 as the selling pressure remained high. Currently, the price appears to be recovering to the $37.00 mark, but the selling pressure makes it difficult for the bulls to gain momentum.

Polkadot price analysisThe price has dropped down to $36.
Polkadot price analysis confirms a downtrend.
Support is standing at $35 point.
The latest Polkadot price analysis predicts a downward trend for the day, as the price underwent a considerable decline in the last 24-hours. Although the bulls were at the leading position earlier, the current scenario favors the bears. The price moved down to $36 today as a result of the sudden drop. We can expect the price to touch further lows in the next few hours if the bearish momentum strengthens.

DOT 02/12Weekly:
Retest level got broken and is now acting as resistance
Daily:
Bearish W
4H:
Entry 1 is already in play (small bearish W after touch daily zone)
Entry 2 limit will be set if candle closes bearish (h&s + bearish W with IC and descending trendline)

Polkadot´s 5 tasks on the 4h chartPolkadot´s 5 tasks on the 4h chart...
1. breakout of the red trendline channel
2. flip the MA Ribbon bullish (green)
3. break the volume resistance
4. breaout of the red trendline channel on OBV
5. confirm breakout(s) and have fun 😎
Drop me a nice comment if you'd like me to analyze any other cryptocurrency or do another comparison.
*no financial advice
do your own research before investing
