DOT NEXT TARGET ??CRYPTOCAP:DOT Polkadot is trading near the lower boundary of the parallel channel pattern on weekly timeframe👀
Strong buying and increased volume suggests accumulation at this critical support zone🧐
If support holds, expect price to bounce towards targets at $6.10, $7.90, $11.00 and $16.00🎯

DOTUSDT: $10 Targeting, Price is at critical level! Hey there everyone
The pair is at a pivotal point where we might see a surge in bullish activity. Remember how price has acted in the past? Well, we can expect something similar, leading to a sudden jump to $10. It’s a fantastic opportunity, but it also comes with a fair bit of risk.
Wishing you a

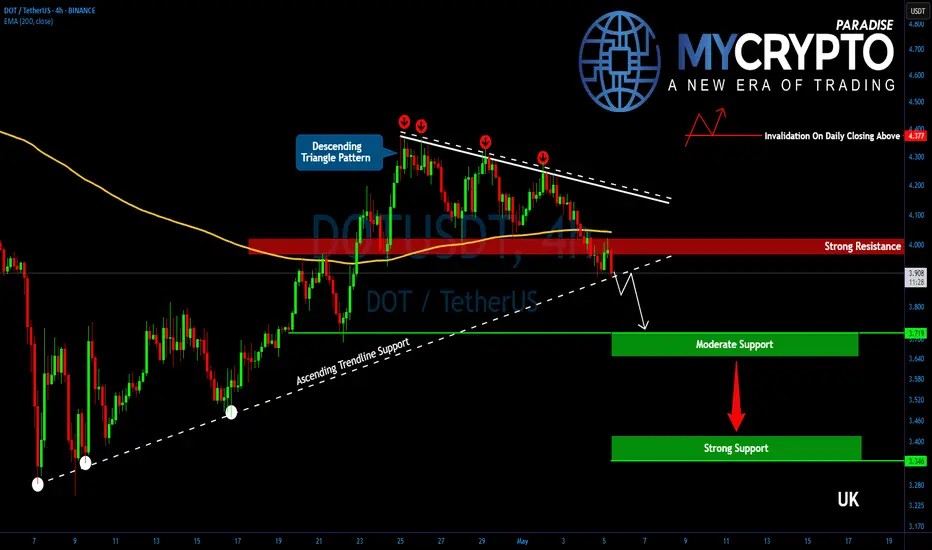
DOTUSDT Is Hanging by a Thread! Breakdown Ahead?Yello, Paradisers! Is #DOT about to hit new yearly lows? The structure is getting ugly again—don’t get caught off guard as this setup is starting to turn dangerous fast.
💎After a brief and weak corrective bounce, DOTUSDT is once again losing steam. The price has already broken down from a descendin
Polkadot Next Target Confirmed ($16.8 —PP: 285%)My sources within the Cryptocurrency market have confirmed the next target for Polkadot (DOTUSDT) in the short- to mid-term, that is a target of $16.8 for total profits potential of 285% from current price.
There is a full bottom reversal complete based on an inverted head and shoulders pattern (iH

DOTUSDT UPDATE
DOT Technical Setup
Pattern: Falling Wedge Breakout
Current Price: \$4.28
Target Price: \$7.32
Target % Gain: 75.83%
Technical Analysis: DOT has broken out of a falling wedge on the 1D chart, with a strong bullish candle and 7.86% daily gain signaling momentum. Breakout suggests potential upside

DOT breakout alertSuccessfully breakout this resistant line with a short -term target of at least +10%

Triple Triangle Pattern Hints at Major DOT BreakoutThe DOTUSDT pair on the weekly timeframe is showing a strong pattern of historical buying interest around the $3.565 support zone. This level has been tested four times since October 16, 2023, and each time it has acted as a critical point for bullish reversals, forming triangular pricing channels.

Polkadot Setup Unfolding - Wait for the Breakout!🔍 Polkadot (DOT/USDT) Technical Breakdown
Currently analyzing DOT/USDT, and when we zoom out to the higher timeframes (📆 weekly and daily), it’s clear that price remains in a macro bearish trend 📉. We’ve recently seen a deep retracement into the upper end of the range — a region I would classify as

Polkadot (DOT): Seeing Good Shorting EntryPolkadot is showing a decent entry forming where price has been pressuring the upper side of the bullish trend and even formed a nice fakeout above it.
We are looking for further weakness to kick in where price will fall back to bullish trends support line from where we might be heading toward the
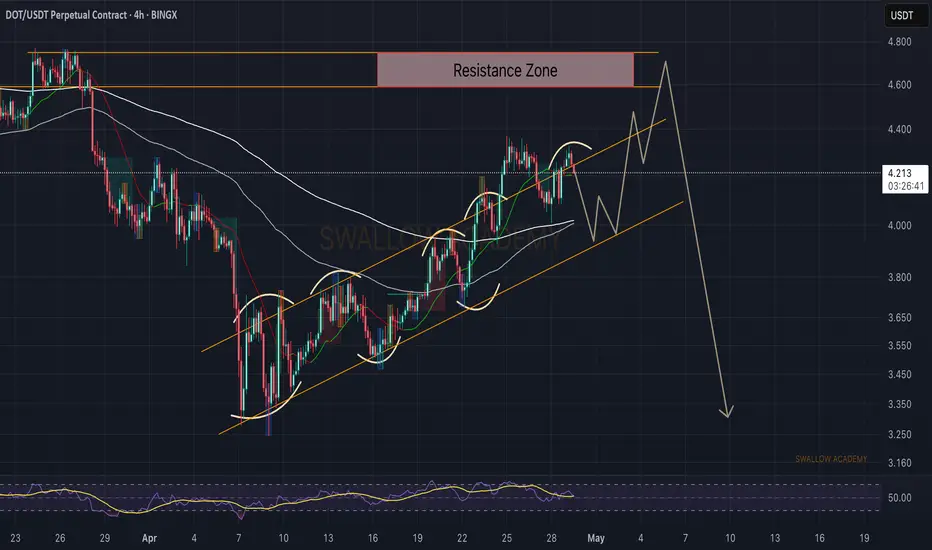
DOT/USDT 1H Chart UpdateDOTUSDT broke its Long-Term Resistance last week!
After consolidating in a Redistribution phase (similar to mid-April), Polkadot is now testing the $4.00 support zone.
▸ Bullish Target: If $4.00 holds, we could see a climb to $4.50 or higher!
▸ Bearish Risk: A breakdown below $4.00 might push the

See all ideas
Summarizing what the indicators are suggesting.
Oscillators
Neutral
SellBuy
Strong sellStrong buy
Strong sellSellNeutralBuyStrong buy
Oscillators
Neutral
SellBuy
Strong sellStrong buy
Strong sellSellNeutralBuyStrong buy
Summary
Neutral
SellBuy
Strong sellStrong buy
Strong sellSellNeutralBuyStrong buy
Summary
Neutral
SellBuy
Strong sellStrong buy
Strong sellSellNeutralBuyStrong buy
Summary
Neutral
SellBuy
Strong sellStrong buy
Strong sellSellNeutralBuyStrong buy
Moving Averages
Neutral
SellBuy
Strong sellStrong buy
Strong sellSellNeutralBuyStrong buy
Moving Averages
Neutral
SellBuy
Strong sellStrong buy
Strong sellSellNeutralBuyStrong buy
Displays a symbol's price movements over previous years to identify recurring trends.