DOT NEXT TARGET ??CRYPTOCAP:DOT Polkadot is trading near the lower boundary of the parallel channel pattern on weekly timeframe👀
Strong buying and increased volume suggests accumulation at this critical support zone🧐
If support holds, expect price to bounce towards targets at $6.10, $7.90, $11.00 and $16.00🎯
DOTUSDT trade ideas

Polkadot Setup Unfolding - Wait for the Breakout!🔍 Polkadot (DOT/USDT) Technical Breakdown
Currently analyzing DOT/USDT, and when we zoom out to the higher timeframes (📆 weekly and daily), it’s clear that price remains in a macro bearish trend 📉. We’ve recently seen a deep retracement into the upper end of the range — a region I would classify as premium pricing 💰.
Despite the recent bullish momentum 🔼, I'm exercising caution when it comes to long positions. From a value perspective, this isn’t where I want to be buying. Instead, my bias leans bearish — but only if specific criteria are met. ✅
I'm watching closely for a clear break of the current range, ideally with:
1️⃣ A market structure break
2️⃣ Strong price displacement (to confirm intent)
3️⃣ A shift in order flow and momentum to support a downside move 🚨
These concepts are influenced by a blend of Wyckoff theory and ICT (Inner Circle Trader) principles 🧠, which I walk through in detail in the video.
📚 As always, this is for educational purposes only — not financial advice. 💼❌

DOT/USDT 1H Chart UpdateDOTUSDT broke its Long-Term Resistance last week!
After consolidating in a Redistribution phase (similar to mid-April), Polkadot is now testing the $4.00 support zone.
▸ Bullish Target: If $4.00 holds, we could see a climb to $4.50 or higher!
▸ Bearish Risk: A breakdown below $4.00 might push the price to $3.90 or lower.
Eyes on $4.00 — will the bulls defend this level? Let’s talk!

Triple Triangle Pattern Hints at Major DOT BreakoutThe DOTUSDT pair on the weekly timeframe is showing a strong pattern of historical buying interest around the $3.565 support zone. This level has been tested four times since October 16, 2023, and each time it has acted as a critical point for bullish reversals, forming triangular pricing channels.
Key Observations
Repeated Support Test at $3.565
DOT has tested the $3.565 support level approximately four times:
October 16, 2023
November 4, 2024
April 7, 2025
Most recent touch in late April 2025, briefly dipping below to trigger buy orders.
Triangular Pricing Channels
Each bullish reversal from this level formed a triangular pattern:
Channel 1: Formed between Oct 2023 – March 2024
Channel 2: Nov 2024 – Feb 2025
Projected Channel 3: Currently forming; expected to play out similarly
Resistance Zone
A strong resistance level at $11.705, which capped gains in both previous triangle patterns.
This level aligns with the projected peak for the next bullish leg.
Bullish Momentum Building
The recent price action has again bounced from the critical support zone, signaling a likely bullish continuation.
The market may attempt to complete a third triangular cycle towards the $11.70 resistance zone.
Trade Setup (Based on Chart Projection)
Entry Point: Around $4.326, close to the current price and above support confirmation.
Stop Loss: Set just below support, at $3.293, accounting for potential fakeouts or liquidity grabs.
Take Profit: Targeting the upper resistance at $11.705, matching historical triangle peaks.
Risk/Reward Analysis
Potential Gain: ~+140.57% (from $4.326 to $11.705)
Potential Loss: ~-23.88% (from $4.326 to $3.293)
Risk/Reward Ratio: Approximately 1:6, indicating a high reward relative to risk, suitable for swing traders.
Conclusion
The weekly chart of DOTUSDT shows a strong historical pattern where the $3.565 level has consistently acted as a springboard for bullish reversals. With a clear triangular pricing structure repeating over time, a potential third bullish wave is now unfolding. A long position near current levels offers an attractive setup with well-defined risk management and a compelling reward potential toward the $11.70 resistance.

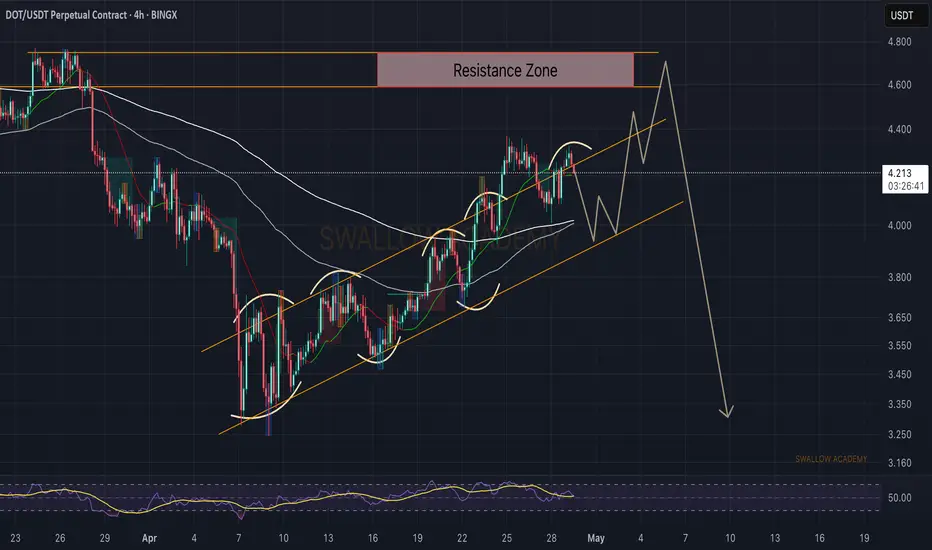
Polkadot (DOT): Seeing Good Shorting EntryPolkadot is showing a decent entry forming where price has been pressuring the upper side of the bullish trend and even formed a nice fakeout above it.
We are looking for further weakness to kick in where price will fall back to bullish trends support line from where we might be heading toward the resistance zone. After that we will be looking for bigger downward movement.
Swallow Academy
DOTUSDT - U should have some DOT in ur portfolio3D chart shows breakout a falling wedge pattern after a drop of 70% ... this is a strong buy signal
so keep ur eye on it! ... target is 12$
Best regards Ceciliones🎯

DOTUSDT 1D AnalysisDOT ~ 1D Analysis
#DOT Buy when re -testing this support with a short -term target of at least 10%+ from here.

DOTUSDDOT is retesting the breakout line which coincides with the bottom of the upward channel.
Support level: $3.96
RSI is bullish.

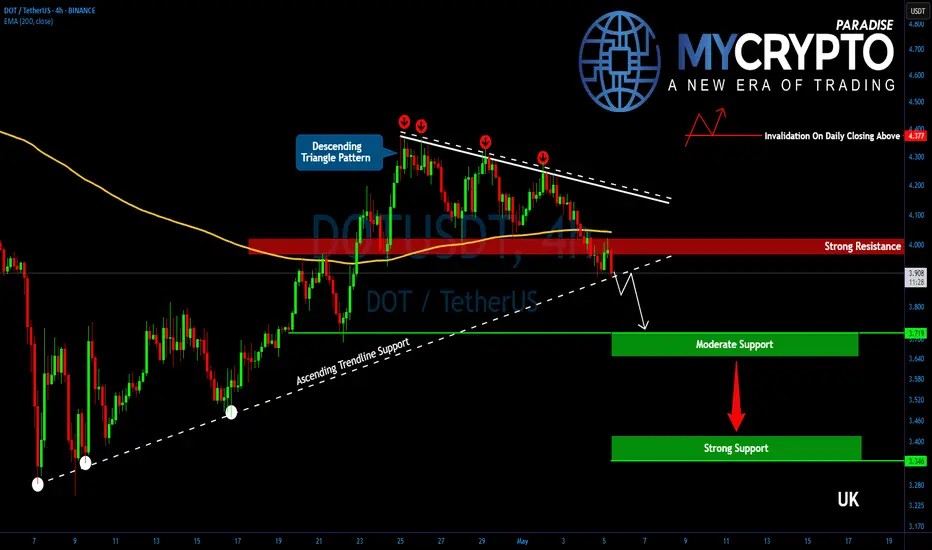
DOTUSDT Is Hanging by a Thread! Breakdown Ahead?Yello, Paradisers! Is #DOT about to hit new yearly lows? The structure is getting ugly again—don’t get caught off guard as this setup is starting to turn dangerous fast.
💎After a brief and weak corrective bounce, DOTUSDT is once again losing steam. The price has already broken down from a descending triangle—a bearish continuation pattern—and is now threatening to breach its key ascending support level. Momentum is shifting aggressively back in favor of the bears.
💎#DOTUSDT is now hanging to the critical $3.90 support level. A decisive breakdown below this zone would likely trigger another wave of selling pressure, opening the door for a drop toward the next moderate support range at $3.72 to $3.65. While this area could attract some short-term profit-taking, the broader trend remains clearly vulnerable, with bearish momentum continuing to dominate.
💎Should bearish pressure continue, and it’s highly likely at this stage that DOT could fall all the way toward the stronger support zone between $3.40 and $3.35. This region marks the 52-week low, and it's where bulls might step in to defend and attempt a meaningful rebound.
💎Additionally, the 2-hour EMA-200 has shown itself to be a strong trend guide. Every time DOT traded above it, bulls had a slight edge. But now that price has once again broken below this moving average, momentum is back with the bears.
Paradisers, strive for consistency, not quick profits. Treat the market as a businessman, not as a gambler.
MyCryptoParadise
iFeel the success🌴
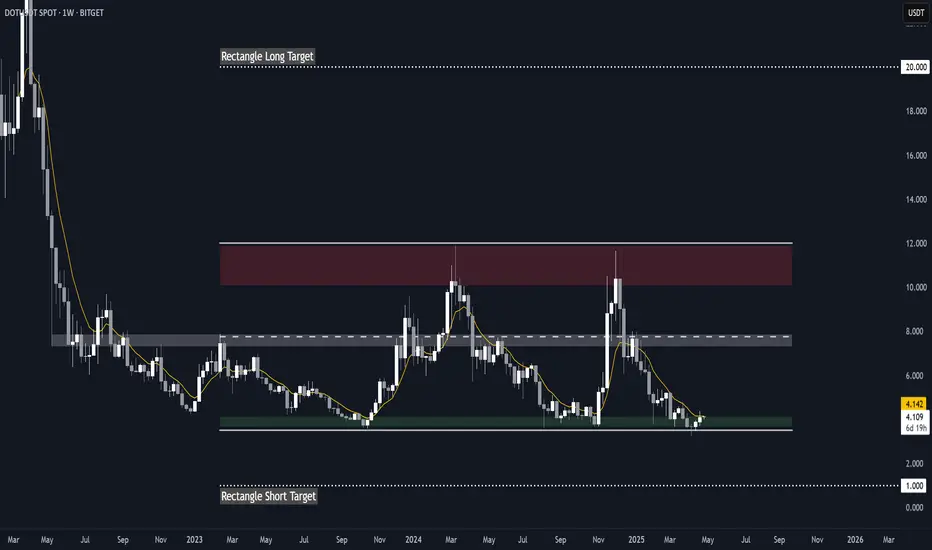
DOT RectangleBITGET:DOTUSDT has been trading in a rectangle since October 2023, with important key levels dating all the way back to May 2022. It also recently broke support, swept liquidity to $3.3 and reclaimed the demand zone, setting itself up for a potential rebound.
Key Levels to Watch
• $3.5-$4.0: Main demand zone
• ~$7.5: Rectangle midline + key S/R dating back to May 2022, could act as a strong resistance
• $10-$12: Main supply zone
Potential targets
Measured rectangle targets
• Breakout: $20
• Breakdown: $1.0
Other Considerations
Another laggard, similar to Filecoin ( ).
While it's still unclear whether these coins are rebounding or heading for a breakdown, they could offer some of the highest R/R potentials for longs, and they have very clear invalidations.
Triggers
• My long trigger for Polkadot would be a break above the 50-day EMA and the demand zone (~$4.0).
• Invalidation (and short trigger) would be a sustained break below $3.5 or a lower low below $3.3.
DOTUSDT LONG/BUYBy utilizing Fibonacci retracement levels, historical patterns, , we can formulate a hypothesis that the market might follow a similar trajectory if bullish sentiment prevails.

DOTUSDT: On The Way To $12 By End Of Year ? BINANCE:DOTUSDT The price of BINANCE:DOTUSDT has taken a turn, and it looks like it’s gonna follow the same pattern. Right now, the market is bullish, and we can see the price heading towards our target in the coming weeks.
Good luck with your trades
Thanks for your support! 😊
If you want to help us out, here are a few things you can do:
- Like our ideas
- Comment on our ideas
- Share our ideas
Team Setupsfx_
❤️

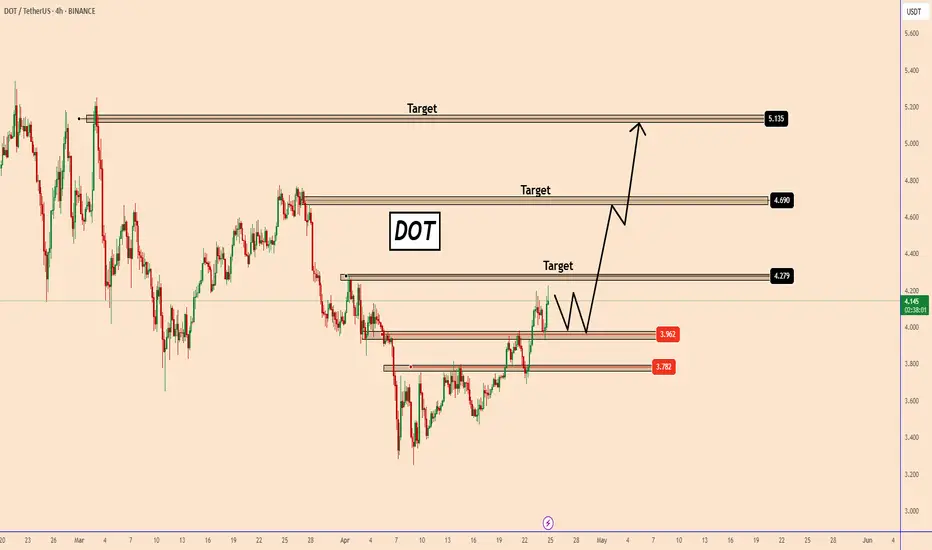
DOT's Bullish Momentum: Key Levels to WatchDOT's Bullish Momentum: Key Levels to Watch
Since April 13, DOT has been forming higher highs, confirming a bullish trend.
The price has already built two strong highs and looks set to begin another upward move.
Before that happens, DOT may linger in the current zone, possibly retesting $3.96.
However, once this level holds, the bullish trend is expected to resume, as shown on the chart.
Key resistance zones to watch:
$4.27
$4.69
$5.13
Once DOT breaks above a resistance level, the next zone becomes the target.
You may find more details in the chart!
Thank you and Good Luck!
❤️PS: Please support with a like or comment if you find this analysis useful for your trading day❤️
DOTUSDTIt should be at $6 and then a correction and a rally to $12 and then a stronger correction and finally a major rally to $24.210
Market geometry is doing its job

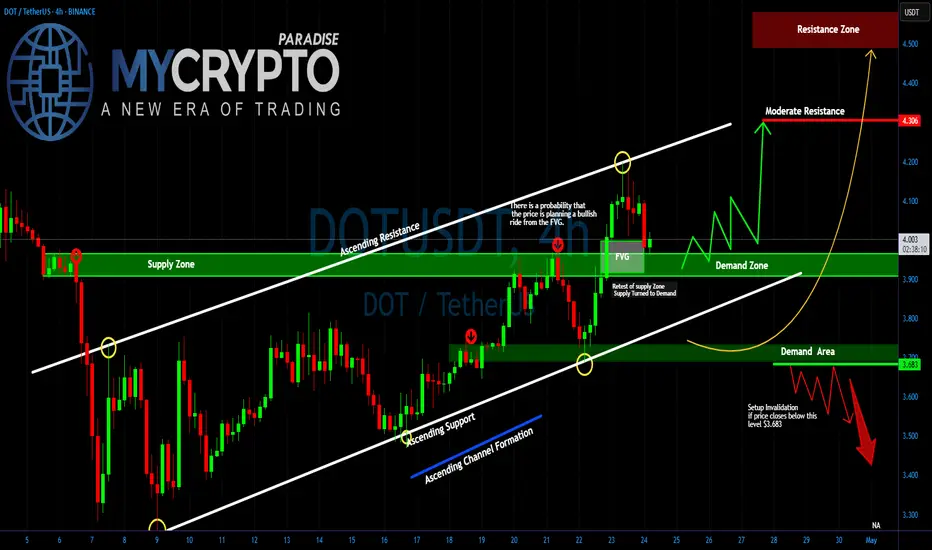
DOT/USDT About to Explode or Crash?Yello Paradisers! Are you ready for DOT's next explosive move, or will you be caught in the trap again? Right now, #DOTUSDT is sitting at a key decision point inside a textbook ascending channel — and what happens next could either print profits or wipe out the unprepared.
💎After respecting both the ascending resistance and support lines with high precision, it has now pulled back into a crucial area of interest: the Fair Value Gap (FVG). If DOT continues to hold above this level, the probability of a bullish continuation increases significantly. The area around $3.90–$3.95 is aligning perfectly with the demand zone, adding to the confluence and giving bulls a strong foundation to build on.
💎However, the real test lies ahead. POLKADOT must clear the immediate resistance around $4.10–$4.30 for the bullish momentum to gain traction. A successful break and retest of the $4.30 level would likely open the doors to a fast move toward the high-value resistance zone at $4.50 and above.
💎But here’s the twist: if DOT fails to defend the demand zone and instead closes below $3.683, the entire bullish setup becomes invalid. Such a breakdown could trigger a deeper correction, targeting the $3.40 region and possibly flushing out the overleveraged players in the process.
Stay focused, Paradisers. Be the hunter, not the hunted
MyCryptoParadise
iFeel the success🌴
DOT the most important historical support!DOT / USDT
The price just toke the liquidity and come back above the most important suppprt level in dot chart with long green wick (strong buy action)
As long as the price continues to close above the current level we think for strong bounce in the coming weeks
However, if and only if the price lose this level on HTF DOT will make new lows
Conclusion: this support acts as DO or DIE for future price action … bullish as long as it stay above it but if it lost on HTF it will into strong bearish
Note: many coins have same chart
Best of wishes

DOT HVFDOT showing us a nice upside HVF pattern on the 15 minute chart. 9.7 risk award ratio for around a 7% move with a target around 4.6 following bitcoin and other Altcoins HVF structures to the upside

dotim not really a fan... but its time
Im just seeing opportunities to go long on good value tokens.
None of this is financial advice, im just pointing out that if you are patient and know what you are looking for then the right times to trade are easy to spot.
my long strat has triggered

DOTUSDTdown trend, supply zone in 4H, v-formation, and pull back. it could reverse to the down side again from here

#DOT/USDT#DOT
The price is moving within a descending channel on the 1-hour frame, adhering well to it, and is heading towards a strong breakout and retest.
We are seeing a bounce from the lower boundary of the descending channel, which is support at 4.05.
We have a downtrend on the RSI indicator that is about to be broken and retested, which supports the upward trend.
We are looking for stability above the 100 moving average.
Entry price: 4.08
First target: 4.10
Second target: 4.15
Third target: 4.20

Polkadot (DOT): Possible Good Buying OpportunityPolkadot has been gliding in that bullish trend where price is approaching the bullish CME gap, which is our smaller target as of now. There we are expecting to see some sort of struggle and rejection until we reach again the lower side of that trend.
Keep in mind, if we break the trend, we will be looking for a short position outside the channel, which would result in a possible move to $2.30.
Swallow Academy


It's disappointing !!!Do you think this will happen, or do you see DOT below $3.5 in the future?
Give me some energy !!
✨We spend hours finding potential opportunities and writing useful ideas, we would be happy if you support us.
Best regards CobraVanguard.💚
_ _ _ _ __ _ _ _ _ _ _ _ _ _ _ _ _ _ _ _ _ _ _ _ _ _ _ _ _ _ _ _
✅Thank you, and for more ideas, hit ❤️Like❤️ and 🌟Follow🌟!
⚠️Things can change...
The markets are always changing and even with all these signals, the market changes tend to be strong and fast!!
