On Track I know alts are flying up in value and this one is taking a little bit longer, but I suggest you give it some time to catch up to other alts. It'll eventually get to FWB:30S range.
DOTUST trade ideas

Dot will start its bullish journey !Dot will have its run after breaking through the resisting point

DOT/USDT Poised for a Bull Run? 👀🚀DOT Analysis💎Paradisers, let's direct our attention to #DOTUSDT, as it's showing signs of a potential significant move from a key demand level.
💎#Polkadot is demonstrating an upward trend, hinting at a likely bullish breakout from its current demand zone. We anticipate a retest of the demand level at $6.38, with a major supply zone in sight. If #DOT holds above this level, it might set the stage for a rise toward the major supply zone at $9.0.
💎However, if #DOT struggles to maintain its position above the support, a reassessment of our trading strategy may be in order. In that scenario, we would look towards initiating a bullish movement from a lower bullish Order Block (OB).
💎It's vital to keep a vigilant eye on this level, as a drop below it could trigger a considerable bearish trend.
💎Stay sharp and flexible, Paradisers. Your ParadiseTeam is committed to offering the latest insights and strategic guidance, ensuring you're fully prepared to handle these market movements.

... $DOTAfter todays flash crash swiftly after $64,000!!!! went as low as $7.643 I dont have a secret sauce i just manage my risk im looking to push up against the previous highs with a 3.5:1 and 6.3:1 with tight stops. EITHER WAY a 30% GAIN....
Not Financial Advice...

DOT waite for rengAnalysis by EZ7.startegy📊
This idea represents a price chart for the crypto asset **DOTUSDT**, analyzed using the **EZ7strategy. Let's break down the key elements:
1. **White Trend Lines**: These lines depict the asset's price movements.
2. **Red Annotation**: It signifies the strategy "Sell in high channel and base bear-trend."
3. **Green and Red Shaded Areas**: These indicate potential buy and sell zones.
4. **Price Levels**: Midle target levels at 7.295 and 7.737 are highlighted.
5. **Oval Highlight**: Indicates where the trendline and candle base broke, suggesting a potential trend change or significant price movement.
6. **DOTUSDT Logo**: Visible at the bottom right corner.
Using images and charts in crypto asset analysis can be valuable for professional traders. This image may provide useful insights into the price trend of DOTUSDT.


📊🌐 DOT - Long Trade Play Strategy! 💹🚀🔍 Strategy Overview:
Condition: Wait for the price to break and retest the $8.50 level.
Entry Criteria: Look for an open and close of a 4HR candle above $8.50.
Targets: Targeting the next resistance at $9.60, followed by $10.73.
Risk Management: Set stop loss just below $8.00.
📢 Analysis: Keep a close watch on the $8.50 breakout and subsequent retest. Evaluate the price action for confirmation and consider implementing risk management strategies. 🌐📈 #DOT #CryptoTrading #Altcoins 🚀💰

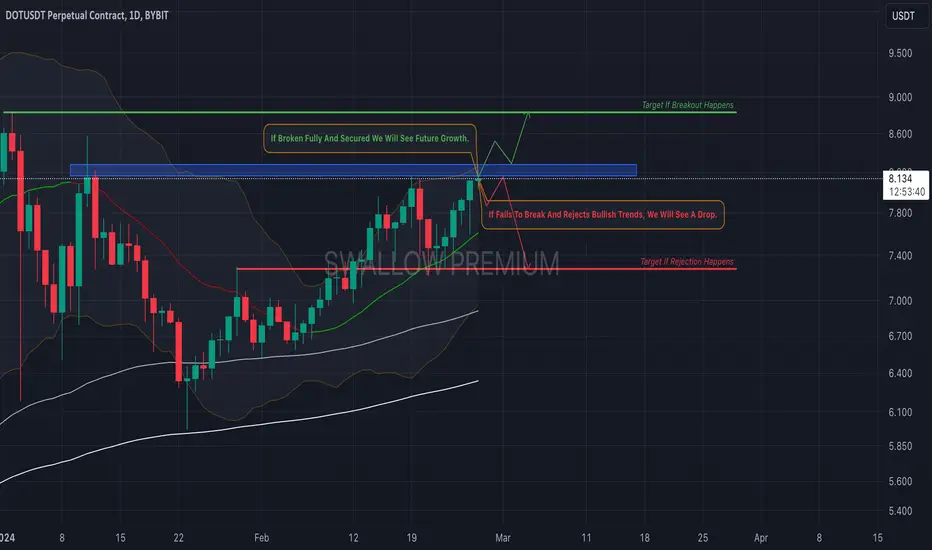
Polkadot(DOT): Breakout or Rejection, We Are Ready!Polkadot has reached the major resistance zone in the daily timeframe, which gives us two possible scenarios here:
First scenario: bullish breakout, which would mean we need to secure that upper resistance and turn it into a support zone for further growth from here.
Second scenario: bearish rejection, which would show the dominance of sellers in the current zone and lead price to the middle line of Bollinger Bands (just as last time) and potentially toward that target zone as well!
Swallow Team
DOTUSDT Identification of Resistance at 8.39 USDT:
You have identified a significant resistance at 8.39 USDT, where the price has repeatedly failed to close above. This is a potentially bearish signal.
Failure to Close Above the Resistance:
The fact that the price failed to close a candle above this resistance strengthens the idea of possible downward pressure.
Confirmation in 1-Hour and 15-Minute Timeframes:
Confirmation in shorter timeframes (1 hour and 15 minutes) reinforces your analysis. It suggests that the resistance at 8.39 USDT is robust across different time scales.
Profit Target at 7.94 USDT:
You have decided to take profits at 7.94 USDT. Ensure that this decision is based on previous support levels or other technical indicators. It's crucial to set profit targets and stop-loss levels before entering a position.
Risk Management:
Always incorporate a risk management strategy into your trading plan. Determine the amount you are willing to lose on this trade and adjust your position size accordingly.
Continuous Monitoring:
Stay vigilant for changes in the market. If the price approaches your profit target, closely monitor for any signs of reversal or consolidation.
Keep in mind that trading carries risks, and it is recommended to exercise caution by using stop-loss orders and risking only an amount you can afford to lose. Additionally, consider consulting other technical indicators or news that might impact the market before making a final decision.

DotHi, Its just an educational analysis, it's not investment advice. Now is the time now is time, Good luck

Entered a sell on DOT
Title: Navigating the Waves of DOT: LORD MEDZ's Sell Strategy
Greetings, fellow trading enthusiasts,
Today, I bring you insights from the volatile seas of cryptocurrency trading. As LORD MEDZ, I've embarked on a new journey, and I'd like to share my latest move with you: entering a sell position on DOT.
Why DOT, you may ask? Well, let's delve into the rationale behind this decision.
Currently, the price of DOT finds itself in a precarious position, nestled snugly between the swing high at $8.57 and the swing low at $6. As any seasoned trader knows, such premium levels present an opportunity to capitalize on market dynamics – particularly the principles of supply and demand.
In essence, my strategy revolves around the age-old adage: sell premium, buy discount. By identifying these price extremes, I aim to leverage the natural ebb and flow of the market to my advantage.
Now, let's address the specifics. Ideally, I'd like to witness a break towards the lower end of the spectrum, around the $6 mark. This would signify a shift in sentiment and potentially pave the way for lucrative opportunities on the horizon.
However, it's crucial to approach this endeavor with a level head and a healthy dose of caution. Cryptocurrency markets are notorious for their unpredictability, and there are no guarantees when it comes to trading.
Therefore, it's essential to proceed with prudence and to conduct thorough research before making any investment decisions. What works for one trader may not necessarily yield the same results for another.
In conclusion, while I remain optimistic about the prospects of this sell position on DOT, it's imperative to exercise diligence and diligence at every turn. As always, the markets are ever-evolving, and adaptability is key to staying ahead of the curve.
Until next time, may the trading winds be ever in your favor.
Disclaimer: The content provided herein is for informational purposes only and should not be construed as financial advice. Trading cryptocurrency involves inherent risks, and individuals should conduct their own research and seek professional guidance before making any investment decisions. LORD MEDZ assumes no responsibility for any losses incurred as a result of the information provided in this blog.

Dot/USDT Bullishbreaking the 9.5 level will take Dot to a massive upward (wave 5) on the long term breaking the ATH

DOT - 2 HrsThis technical analysis is for informational and educational purposes only. It does not constitute financial advice. Remember to always research and consult with a professional before making investment decisions. Good luck! 📈💼🚀


DOWNSIDE IS LIMITDOT are testing strong horisontal level.
Entry by marke price - stop loss $7.66
set limit order at price $7.623 - stop loss $7.52

Long Position on DOTUSDTAnalysis:
Support Trendline: A trendline traced since October 2023 has consistently acted as support, providing a strong foundation for the trade.
Entry Zone: The entry zone for the trade shows a significant volume, indicating potential market interest at this level.
Stop Loss Placement: The Point of Control (POC) from the volume profile is used as a stop-loss level, offering a key support area.
Take Profit Levels:
TP1 and TP2: Historical areas with good volume have been identified as take-profit levels, providing potential areas of resistance-turned-support.
TP3: The upper 70% line of the volume profile is targeted as the third take-profit level, coinciding with a historically significant volume level.
Trade Plan:
Entry: Consider entering a long position as the price reaches the support trendline, especially within the zone of high volume.
Stop Loss: Protect the trade with a stop-loss order placed at the Point of Control (POC) from the volume profile.
Take Profit:
TP1 and TP2: Partially close the position at the historical areas of good volume, which may act as resistance-turned-support levels.
TP3: Target the final portion of the position at the upper 70% line of the volume profile, aligning with historically significant volume.
Risk Management: Ensure proper risk management by allocating an appropriate portion of your capital to this trade and adjusting position size accordingly.
Note: Always conduct thorough analysis and consider using additional technical indicators or confirmatory signals before executing any trades. Risk management is crucial to protect your capital in volatile markets.

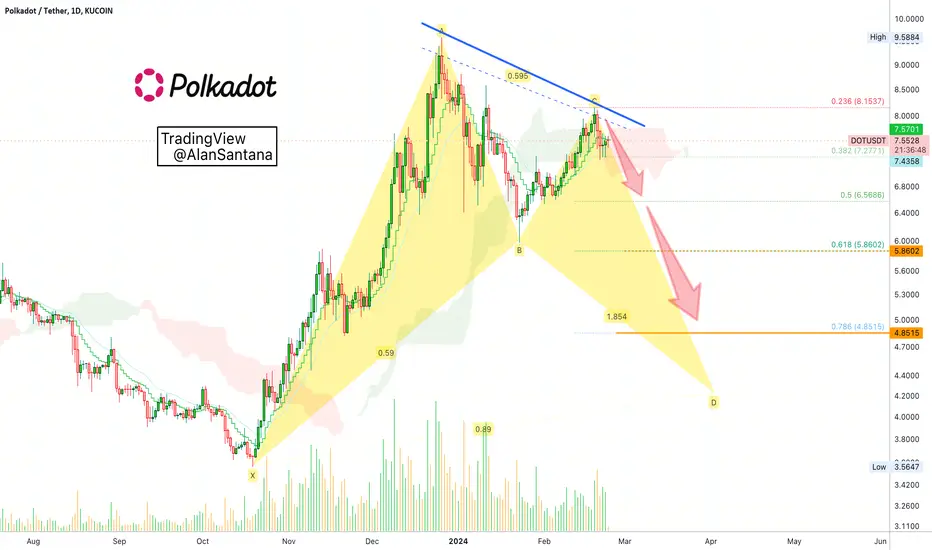
Polkadot Bearish Bat (Next Target Between 4.85 - 5.55)➖ The lower high is now in place. It came in 19-Feb.
➖ The current candle has an upper shadow and is currently trading at the session low below EMA10.
➖ Trading volume continues to decline since 9-Dec.
➖ Bearish harmonic pattern.
➖ Polkadot (DOTUSDT), has been moving with a bearish bias for two months.
All these are bearish signals.
➖ Correlation with the rest of the big Altcoins.
➖ Positive correlation with Bitcoin.
The next target can be found between 0.786 and 0.618 Fib. retracement level relative to the previous bullish wave. This is between 4.85 and 5.86.
Thank you for reading.
Prepare for the drop.
Happy Full Moon!
Namaste.
Polkadot $DOT Elliot Wave CountPolkadot Elliot Wave 21/11/2022
A large number of DOT holders has been selling bags and I expect the price could get lower. I suggest you DCA or wait for abit before buying a bag.

DOT/USDT 1DInterval Chart ReviewI invite you to review the DOT chart, taking into account the interval of one day. We will start by identifying the downward trend line from which the price came out on top and created a local uptrend channel, in which it is currently struggling to stay inside the channel.
Further, after unfolding the trend based fib extension grid, you can see the first significant support at the level of $6.79, then the second support at the level of $5.93, and then the third very strong one at the price of $5.31.
Looking the other way, we can similarly determine the resistance areas that the price must face. And here we see that currently the price has been rejected by the resistance at the level of $8.05, it still has to face the resistance zone from $8.95 to $9.40 so that it can grow further towards the level of $10.74.
Please look at the RSI indicator, because, like the STOCH indicator, there is a visible recovery and both indicators show room for a deeper correction.

DOT Will MOON Like UNI MartyBoots here. I have been trading for 17 years and I am here to share my ideas with you to help the Crypto space.
DOT will have have a nice move in very near future but watch the video to find out when it can moon . Very important information
It has very good structure and price action , it reminds me of how many other coins set up in the last Bull market before it went parabolic and of course similar to UNI that just mooned
Please watch the video for more information
have a great weekend

Polkadot(DOT): Waiting For Trend Break!Polkadot caught our attention on a 4-hour timeframe with multiple attempts to breakdown from that single trend that has been occurring since the beginning of this month!
With that being said, we are aiming to see those EMAs (100 and 200) touched and re-tested one more time before any further significant movement (either to upper zones or to lower zones)
Swallow Team

DOT updateHere is Example of Level(s) importance!
8.20 is where we must take a profit.
(For Educational purposes).
