Riding the Bull Wave, but Watch for the Dip!Analyzing the given data for DREP/USDT, we note a significant increase in price by 70% over the last 24 hours. The current price is $0.4520.
Starting with Fibonacci retracements, these levels are often significant in determining possible support and resistance areas. From the provided levels, we can compute the 0.382 and 0.618 levels. They are at approximately $0.4797 and $0.4476 respectively.
Turning to Bollinger Bands, the upper, middle, and lower bands are at $0.4973, $0.3597, and $0.2218, respectively. Prices often oscillate between these bands, and their width can indicate market volatility.
The Relative Strength Index (RSI) stands at 62. This shows that the asset is not in an overbought or oversold state.
The Stochastic oscillators, reading at 77, suggest that the price may be nearing overbought territory, but it's not conclusive at this point.
The MACD, at -0.0343, is currently indicating a bearish signal, though the strong upward price movement may change this trend.
The Volume Oscillator, at 73%, indicates increased trading volume. The On-Balance Volume (OBV) is at 14B, supporting the upward price movement with solid volume.
The 50-day Exponential Moving Average (EMA) is at $0.3978, below the current price, which typically suggests an ongoing bullish trend.
For key prices, strong support could be the daily timeframe 1 Fibonacci level ($0.3915), which is also near the EMA 50. On the upper side, resistance might be found at the 0 Fibonacci level ($0.5358), which is also near the 24-hour high ($0.5173). The daily timeframe 0.5 Fibonacci level at $0.4637 might act as interim support or resistance.
In conclusion, the data suggest that DREP/USDT is currently in a bullish phase. However, it's important to monitor these indicators to anticipate any potential reversals or continuations in the trend.
We see a mix of bullish and bearish indicators. The substantial price increase of 70% in the last 24 hours, a robust Volume Oscillator at 73%, and the On-Balance-Volume (OBV) of 14B all point to a significant bullish momentum. The price being above the 50-day EMA further confirms the bullish trend.
However, the Stochastic Oscillator at 77 and the RSI at 62 suggest that the asset may be approaching overbought territory, which can sometimes precede a price correction or "dumping." The MACD being in the negative territory also signals potential bearish momentum.
While these indicators provide valuable insights, they don't guarantee a certain outcome. Predicting market movements with absolute certainty is impossible due to the complex and dynamic nature of financial markets.
However, based on these indicators, it appears that there is strong upward momentum for now, but the asset might be nearing an overbought condition. Hence, while the immediate trend appears to be bullish, a pullback or consolidation might not be far off.
DREPUSDT trade ideas

Drep Approaching Towards Key resistance Seems Like Has already Bottomed Out And Approaching towards Trendline In 3days timeframe Incase Of breakout expecting 300%+ Bullish wave

looks good rnyou can do this drep! i still have faith in you.. the market is in correction mode. super indecisive trade safe

DREP, ready for the next leg up!expecting at least 40% on the next leg up. trade safe. don't get rekt


DREP DREP DREPget in the bus, we're going for a long ride. Don't tell me I didn't tell you! trade safe NFA, don't get rekt

#DREP/USDT - Long - Potential 9.94%Direction: Long
Market: Spot
Risk: 0.25% - 1%
#USDT_DREP
Exchange: BINANCE
Timeframe: 360
TP1: 0.5407
Entry: 0.4924
STOP: 0.4441
Entry Conditions:
| Trendline breakout
| On support

DREPUSDT 64% ✅🚀#DREPUSDT
we published and shared this idea with you in our profile here as you can check the previous analysis for #DREPUSDT
and this analysis gave really good and massive profits
Target 3️⃣ : done✅
Entry price: 0.5959$✅
Price reached :0.9500$ ✅
Profit: 64% ✅🚀🚀🤑
Thank you, and for more ideas, hit "Like" and "Follow"!
You may also TELL ME in the comments section which symbol you want me to analyze next and on which time-frame. The one with the most posts will be published tomorrow! 👏🎁

Drep looks Promising for midterm Approaching towards Trendline Resistance In Htfs Incase Of breakout expecting Massive bounce
Incase Of breakout expecting 180 To 200% bulish move

DREP You love madnessTwo paths without a third
The currency breached the descending channel on the weekly chart
Even in its descent it did not close lower than the descending channel
Any break of the descending channel is considered invalid

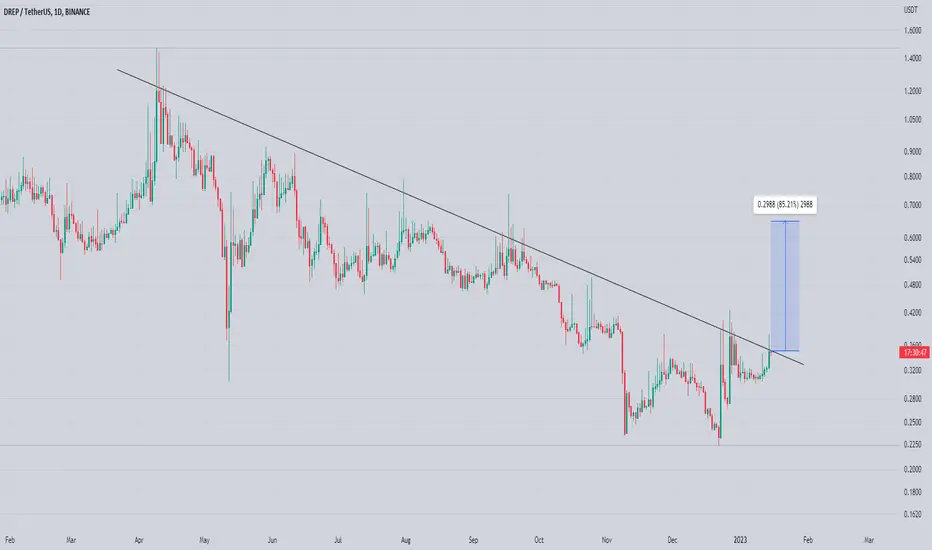
Drepusdt Testing Daily TrendlineDrep Testing Tl In Daily Tf Incase Of Breakout Expecting 90% Bulish Wave Entry Would Be valid After Confirmed Breakout Place Sl According Your Rrr
Drep Token formed bullish Gartley for upto 48.50% pumpHi dear friends, hope you are well and welcome to the new update on Drep token with US Dollar pair.
Recently we caught a nice pump fo Drep as below:
Now on a daily time frame, Drep has formed a bullish Gartley move.
Note: Above idea is for educational purpose only. It is advised to diversify and strictly follow the stop loss, and don't get stuck with trade

Drep Token formed bullish Cypher for upto 33% moveHi dear friends, hope you are well and welcome to the new update on Drep token with US Dollar pair.
Recently I shared a trade setup for Drep, but the priceline pumped before the completion of the final leg of a Shark pattern:
Now on a 1-hr time frame, DREP has formed a bullish Cypher pattern.
Note: Above idea is for educational purpose only. It is advised to diversify and strictly follow the stop loss, and don't get stuck with trade

Drep Token forming bullish Shark for upto 78% moveHi dear friends, hope you are well and welcome to the new update on Drep token with US Dollar pair.
On 4-hourly time frame, Drep is about to complete a bullish Shark move.
Note: Above idea is for educational purpose only. It is advised to diversify and strictly follow the stop loss, and don't get stuck with trade

DREP: WHY THIS MARKET ORDER OF 40% in 1HOURDepending on the last market show we see that just in 1H a high orders trend did start on this coin, but what is the reason that this coin could go in just 1 Hour 40%?
Directly orders can have different reasons as we never will know exactly why this market trade exactly is adding, is there a new trend coming on this coin, or a start of a whale trend? but same time it could be nothing and just a market movement.
SNM had before around the same trend when we did scan it at 20% increase in the same hour but was able to increase by 5000%, after that we have seen also the breakdown.
In other words, manage the risk well in any trade, and don't just go FOMO.
To confirm this increase we need to have some confirmations first.
At this moment there is still no confirmation of this increase can go further. Time will show us if this coin is able to make real gains, or if it's just a one-time volume trend.
if its able to increase, then is the next target 0,73 a very important target
But movements like this have most time a reason, and it's not for nothing made.
This update is just a view from our side, from the side of learning about the increase in views and the reasons behind it.
This update is not trading advice or suggestions for the choice of a side.
even if you have the confirmation to go in the trade as this, never do it with more than 10% of your investments and with the right risk management.
coins like this can have high rewards and same time high risk.

DREP USDT TODAYI've already made my first entry 40%.
Waiting to come back to the second entry zone to plus 60% on that #drep expecting the yellow targets.
The Chart is illustrative enough.
If you don't understand sth just comment.
Don't forget to apply your own risk management.


Drep Token formed bullish Cypher for upto 19.50% moveHi dear members, hope you are well and welcome to the new update on Drep token with US Dollar pair.
On a 4-hr time frame, DREP has almost completed a bullish Cypher pattern.
Note: Above idea is for educational purpose only. It is advised to diversify and strictly follow the stop loss, and don't get stuck with trade

$DREPhola people !!
hopped off qkc since the volume was dropping like a brick
most likely moves back up mid week since Binance usually make announcements on a Thursday
DREP looking yummy with a break out and close above key level on the btc pair
last line of defense here for the teddy's

DREPUSDT#DREPUSDT
(LONG SIGNAL)
(SWING TRADE)
MACD is showing bullish
EMAs showing neutral
RSI is bearish
targets set at the chart
We have really powerful support since may 2021 the price keep moving at the same support so i expect this is good opportunity for swing trade

DREPUSDT#DREPUSDT
(LONG SIGNAL)
(SWING TRADE)
We have really powerful support since may 2021 the price keep moving at the same support so i expect this is good opportunity for swing trade
MACD is showing bullish
EMAs showing neutral
RSI is bearish
targets set at the chart

$DREPthought i'd post the usdt pair
imo we fly soon since the volume is creeping up and mcap is still tiny
volume preceeds price :)

DREP 1D Bullish Triangle1. Volativity on DREP goes down.
2. RSI 1W still in bullish zone 40.00
Will it ROCKET now from 0.60$
or
From the support zone with a price of 0.38$ ? As the bullish triangle can end there at the end of November.
