Nas faq intra day buys setupRe accumulation setup for nasdaq intra day buys , market structure on daily looking bullish
NDQUSD trade ideas

nasdaq us100 buy/longtarrifs
interest rates
use proper risk management
#interest rates
#fomc
#ppi
#cpi
#jerome powell

The RangeThe area at which Nas100 is ranging is a very manipulative area whereby there is a high possibility that continuation of buys might occur, induction of sellers by sweeping lows within a premium area might cause us trouble

NSDQ100 INTRADAY uptrend continuationUS-China Trade Talks:
The Trump administration is considering cutting tariffs on Chinese goods to below 60% during upcoming talks. China may reciprocate. Chinese exports to the US have already dropped sharply following earlier steep tariffs.
Global Market Reaction:
Germany's DAX index hit a new high, recovering losses from the trade war. European stocks are rising on hopes of lower tariffs and potential rate cuts from the European Central Bank.
US Tax Policy:
Trump is urging Congress to raise taxes on the wealthy, proposing a 39.6% rate for individuals earning $2.5 million or more (or $5 million for couples).
Panasonic Job Cuts:
Panasonic plans to cut 10,000 jobs to improve profitability by focusing on growth areas and reducing operations in weaker sectors like TVs and industrial devices.
Key Support and Resistance Levels
Resistance Level 1: 20530
Resistance Level 2: 20730
Resistance Level 3: 20950
Support Level 1: 19640
Support Level 2: 19325
Support Level 3: 19030
This communication is for informational purposes only and should not be viewed as any form of recommendation as to a particular course of action or as investment advice. It is not intended as an offer or solicitation for the purchase or sale of any financial instrument or as an official confirmation of any transaction. Opinions, estimates and assumptions expressed herein are made as of the date of this communication and are subject to change without notice. This communication has been prepared based upon information, including market prices, data and other information, believed to be reliable; however, Trade Nation does not warrant its completeness or accuracy. All market prices and market data contained in or attached to this communication are indicative and subject to change without notice.

Technical Breakdown on US100 | 1H TimeframeTechnical Breakdown on US100 (1H) using Volume Profile, Gann, and CVD + ADX
1. Key Observations (Volume, Gann & CVD + ADX Focused)
a) Volume Profile Insights:
Value Area High (VAH): 20,050
Value Area Low (VAL): 19,800
Point of Control (POC): 19,927.77
Volume Nodes:
High-volume node: Consolidation around 19,930–20,000 (strong interest/acceptance zone).
Low-volume gap: Below 19,800 (potential area for fast price movement).
b) Liquidity Zones:
Clustered Stops:
Above recent highs at ~20,100 (liquidity trap).
Below recent lows near 19,650 and 19,500.
Order Absorption Zones:
Near 19,930–19,980: multiple rejections + high delta volume = passive sell pressure.
c) Volume-Based Swing Highs/Lows:
Volume spike highs: 20,050 (indicating rejection and potential reversal).
Volume spike lows: 19,600–19,650 (reaction points with increased volume and defense).
d) CVD + ADX Indicator Analysis:
Trend Direction: Turning bearish.
ADX Strength:
ADX slightly above 20 with DI- crossing above DI+ = Confirmed downtrend.
CVD Confirmation:
Falling CVD alongside price weakness = Strong supply taking control.
Multiple failed bullish attempts above POC.
2. Support & Resistance Levels
a) Volume-Based Levels:
Support:
19,800 (VAL)
19,650 (swing low with high absorption)
Resistance:
20,050 (VAH and rejection zone)
19,927.77 (POC, now resistance)
b) Gann-Based Levels:
Swing High: 20,100 (Gann reversal point)
Swing Low: 19,650
Key Gann Retracements:
1/3 retracement = ~19,820
2/3 retracement = ~19,980
3. Chart Patterns & Market Structure
a) Trend: Bearish
b) Notable Patterns:
Bearish flag forming inside descending channel.
Break below POC and VAL suggests breakdown continuation.
Retest failure near POC confirms resistance validation.
4. Trade Setup & Risk Management
a) Bearish Entry (CVD + ADX confirm downtrend):
Entry Zone: 19,920–19,940 (retest of POC)
Target:
T1: 19,650
T2: 19,400
Stop-Loss (SL): 20,060 (above VAH and swing high)
Risk-Reward (RR): Minimum 1:2
b) Position Sizing:
Risk only 1–2% of trading capital per setup.

NAS100: Back in Beast Mode? Channel Top in SightThe NAS100 has stormed back into bullish territory, carving out a clean upward channel. If momentum holds, we could see price test the top again—setting up a textbook double or triple top. Here's what to watch and where this might stall.


NASDAQ-100 Head & Shoulders Breakdown?I've been tracking a potential head and shoulders pattern on the NASDAQ-100, with a neckline at 17,720. If the pattern completes and breaks down convincingly, the measured move projects a target near 13,200 — a significant potential drop.
While technical patterns aren’t guarantees, they often coincide with underlying fundamentals. In this case, there are several macroeconomic headwinds that could catalyze such a decline:
Sticky Inflation and Interest Rate Uncertainty: Despite some progress, inflation remains above the Fed’s target. A “higher for longer” rate environment continues to pressure equity valuations, especially in tech-heavy indexes like the NASDAQ-100.
Weakening Consumer and Corporate Spending: Retail sales and corporate earnings revisions have shown signs of fatigue, suggesting slowing momentum in key economic drivers.
Global Tensions and Supply Chain Risks: Ongoing geopolitical instability, including issues in the Middle East and renewed U.S.–China trade rhetoric, could reignite volatility and affect global growth assumptions.
Overvaluation and Narrow Market Breadth: A small group of mega-cap tech names have driven much of the recent rally, leaving the broader market vulnerable if leadership falters.
With technical and fundamental factors aligning, this setup is worth watching closely. A confirmed break below the neckline could be more than just a chart pattern—it may reflect a broader shift in sentiment.

Long-term bearish to 14kJust adding to the idea previously posted:
A black upward trendline shows a strong bullish trend from mid-2022 through early 2025. Recently, there’s been a significant breakdown below this trendline, which signals a substantial change in trend from bullish to bearish. On Friday, we tested and rejected this trendline, which at the same time tested a 65% (golden pocket) retracement of the recent move, indicating a possible resistance area after a strong rebound.
I expect the price not to break this level any further.
The target remains 14k and below.

US100 shows early signs of uptrend with break of trendlineUS100 shows early signs of uptrend with break of trendline. It may retrace before upward momentum.
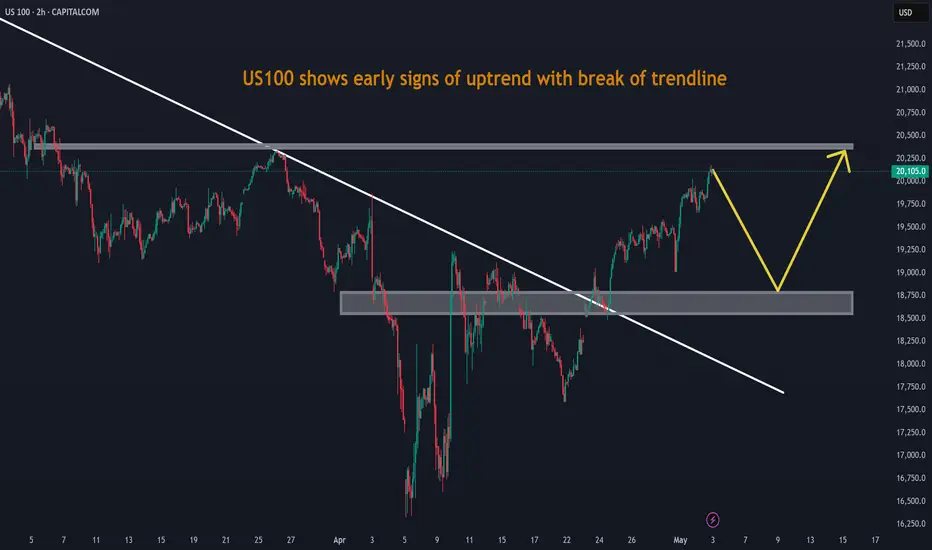
US100US100 has shown great strength after terrif news.
If we look at the bigger picture, recent bullish rally looks like a pull back. Currently it is heading towards very important region , 20500 which is also the 61% retracement level.
If the price close above 20500 then we can consider it a new bullish rally.

next week or two weeks NQ vision as u see in the chart nothing special we need to reach the first high Buyside LQ
then pull back to the last low as second target sellside LQ
note that
any question feel free

Nas100 Diamond BottomAt the 16400 gap down the play was simple, buy, fill the gap and bullish engulf this puppy.
So it happened, and the 10 percent pump is the middle of the diamond. Then what was left to be bullish on the final retraces onto the right side of the diamond.
Now we are in. I expect exponentiaal growth, but first target is the magic average plotted on this chart.
Good luck and remember, no guarantees. I play the chart and trust it, but if it backfires thats my risk im willing to take.

NAS100USD: Price Respects Bearish Structure at 62% FibGreetings Traders,
In today’s analysis on NAS100USD, we observe sustained bearish institutional order flow, and we aim to align with this directional bias by identifying high-probability selling opportunities.
KEY OBSERVATIONS:
1. Retracement into Premium Resistance:
Price has recently retraced into premium pricing levels, reaching the 62% Fibonacci retracement zone—a level that often acts as dynamic resistance. This retracement also aligned with a bearish breaker block, confirming institutional resistance at that level. The market has since shown signs of rejection, reinforcing the bearish narrative.
2. Emergence of Fair Value Gap (FVG) as a Key Resistance Array:
Following the rejection, a new FVG has formed, acting as a potential short-term resistance zone. This area provides a refined point of interest where institutions may look to re-engage in selling activity. The alignment of the FVG with previous resistance adds further confluence to the bearish setup.
TRADING PLAN:
We will monitor the newly formed FVG zone for signs of bearish confirmation. Upon confirmation, the plan is to execute short positions targeting liquidity pools in discounted price zones, in line with institutional price delivery patterns.
Remain focused, wait for confirmation, and make sure this idea aligns with your overall trading plan.
Kind Regards,
The Architect

A Possible Play For Nasdaq if you keep a close eye on this here is a possible out come for the next few months for Nasdaq so keep an eye out for it but don't be married to it

Nasdaq analysis: 30-APRIL-2025Good morning. Welcome to today's Nasdaq market analysis and educational insights for price action traders.

It's all about TIME FRAME.For some, this seems a concept to understand...
Yes, you can be BOTH bullish and bearish stock markets at the same time.
It's all about TIME FRAME.

US100 Locking as Bullish directionUS00 Structure Looking as strong Bullish Pattern,
Forecast from Mr Martin Date 02 May 2025,
US100 Price will looking as buy side recently price will break and catch the support after push to buy side the bullish structure continue to play out the next project would be a clean rally toward the top of the channel US100 is holding its bullish structure well,
Key Level to watch
Resistance level 20,500 / 21,000
Support Levels 19,500
you can find more details in the chart of you find this idea help or learned something new then leave comments Thanks for Regarding.

Bearish Look for potential Reversal bearish candlestick formation upon the retest of daily supply zone.

Approaching 200SMA and long-term uptrend line, pullback expected(The following is a personal opinion and not investment advice. Please exercise independent judgment before making any decisions.)
Last week, the market remained in a consolidation phase near recent highs. The current price has broken through and is approaching the 200-day moving average, while also nearing a retest of the uptrend line that began in 2023. Considering the price has been on a 9-day upward streak, there is a high probability of a significant pullback upon reaching these key resistance levels.
At present, it is difficult to categorize the overall market trend as either bullish or bearish. With ongoing uncertainty around tariff-related policies, the market appears to be in a consolidation phase rather than a sustained uptrend, lacking fundamental support for further rallies. As such, there is a higher probability that the price will fill the lower gap at 18,264.
Next week, special attention should be given to the FOMC rate decision and the press conference on Wednesday. Recent employment data has been strong, and inflation has shown signs of rising. The Fed is expected to maintain its current stance, which could trigger a market sell off. It's also possible the pullback may begin as early as Monday or Tuesday, offering opportunities for early positioning.
From a technical perspective, if the price continues to rise, it may test the area around the 200-day moving average and previous trend resistance, roughly between 20,226 and 20,400. Should this area be tested early in the week (Monday or Tuesday), I would consider initiating short positions. Light positions can be considered above the 20,000 level, as the current price range offers a relatively favorable risk-to-reward.
To the downside, a break below the 19,000 level is required first, after which there's a higher probability of filling the price gap between 18,264 and 18,583. If supported by macro news, the market may further test lower levels in the coming weeks, including 17,589, 17,278–16,946, and potentially 16,108–16,589. These levels will require further observation as developments unfold.

Are You Ready For Nasdaq Next Flight ? 500 Pips Waiting For Us !Here is my opinion on Nasdaq , i think we have a very good closure and we can say we will go up for sometime in the next few days , so i`m waiting the price to go back to my support area ( Lower One ) that already broken , and then we can enter a buy trade and targeting 500 pips . also if the price touch the higher place and give me a good bullish price action , we can enter a buy trade with small lot size and if the price go to the lower one we can add one more contract .

NASDAQ SCENARIO 27/04/2025English : According to our analysis, we anticipate a BULLISHscenario.
Morocan Darija : kanchofo d'apres l'analyse dyalna antsanaw TLOO3
ATENTION : I only share my ideas, not signals

Descending Triangle Formation with Bullish Breakout Potential The NASDAQ (US100) is currently forming a descending triangle pattern with a clear A-B-C-D-E wave structure, signaling price compression and consolidation.
🔍 Key Insights:
The previous move was strongly bullish, increasing the probability of a continuation after consolidation.
A potential breakout above the descending trendline (blue resistance) could trigger a sharp upward move.
Target zones:
✅ First target: 20,060.6
✅ Second target: 20,573.9
Key support zone: 19,524.7 – this area acted as a launchpad for the previous bullish impulse and confirms the base of the triangle.
🧠 Suggested Strategy:
Wait for a confirmed breakout with volume. Look for entries on a pullback toward the 19,811.1 zone – ideally with a bullish continuation candle.
📊 Additional Context:
These types of consolidation patterns often lead to explosive moves. Patience and risk management will be crucial here.
