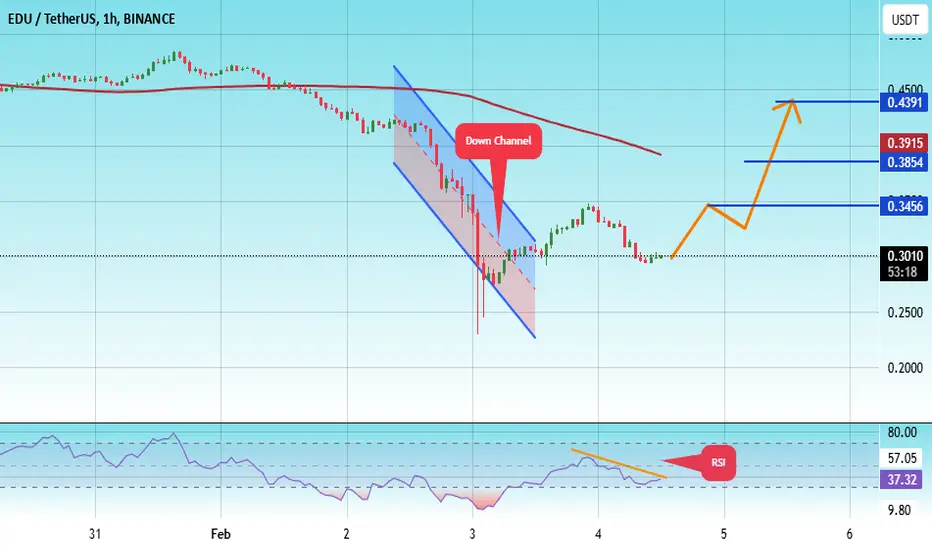
#EDU/USDT#EDU
The price is moving in a descending channel on the 1-hour frame and is expected to continue upwards
We have a trend to stabilize above the moving average 100 again
We have a descending trend on the RSI indicator that supports the rise by breaking it upwards
We have a support area at the low

Open Edu Surged 20% Today Gearing to Reclaim $100 Mln Mkt CapOpen Edu ( NYSE:EDU ) native token spike 20% today amidst breaking out of key resistant point setting the coast to reclaim the $100 million market cap.
Built on the BNB chain, The Open Campus Protocol is a decentralized solution for educators, content creators, parents, students, and co-publishers

#EDU/USDT#EDU
The price is moving in a descending channel on the 1-hour frame and is adhering to it well and is heading to break it strongly upwards and retest it
We have a bounce from the lower limit of the descending channel, this support is at a price of 0.2600
We have a downtrend on the RSI indicator

#EDU/USDT#EDU
The price is moving in a descending channel on the 1-hour frame and is adhering to it well and is heading to break it strongly upwards and retest it
We have a bounce from the lower limit of the descending channel, this support is at a price of 0.2300
We have a downtrend on the RSI indicator
#EDU/USDT#EDU
The price is moving within a descending channel on the 1-hour frame, adhering well to it, and is on its way to breaking it strongly upwards and retesting it.
We are seeing a rebound from the lower boundary of the descending channel, which is support at 0.1430.
We have a downtrend on the RSI


EDUUSDT 4DEDU ~ 4D
#EDU If you still have a Conviction on this coin,. This is a very good support block for now. buy gradually with a minimum target of 20%

#EDU/USDT Ready to go higher #EDU
The price is moving in a descending channel on the 4-hour frame and sticking to it well
We have a bounce from the lower limit of the descending channel, this support is at 0.4834
We have a downtrend on the RSI indicator that is about to be broken, which supports the rise
We have a trend to

EDUUSDT VIEWEDUUSDT seems to be aiming for a bullish direction against the daily fair value gap, achieving this will propel the market direction into a massive bearish trend after taking out the necessary
sell side liquidity.

#EDU/USDT #EDU
The price is moving in a descending channel on the 1-hour frame and is expected to continue upwards
We have a trend to stabilize above the moving average 100 again
We have a descending trend on the RSI indicator that supports the rise by breaking it upwards
We have a support area at the low

See all ideas
Summarizing what the indicators are suggesting.
Oscillators
Neutral
SellBuy
Strong sellStrong buy
Strong sellSellNeutralBuyStrong buy
Oscillators
Neutral
SellBuy
Strong sellStrong buy
Strong sellSellNeutralBuyStrong buy
Summary
Neutral
SellBuy
Strong sellStrong buy
Strong sellSellNeutralBuyStrong buy
Summary
Neutral
SellBuy
Strong sellStrong buy
Strong sellSellNeutralBuyStrong buy
Summary
Neutral
SellBuy
Strong sellStrong buy
Strong sellSellNeutralBuyStrong buy
Moving Averages
Neutral
SellBuy
Strong sellStrong buy
Strong sellSellNeutralBuyStrong buy
Moving Averages
Neutral
SellBuy
Strong sellStrong buy
Strong sellSellNeutralBuyStrong buy
Displays a symbol's price movements over previous years to identify recurring trends.