#EGLD/USDT#EGLD
The price is moving within a descending channel on the 1-hour frame, adhering well to it, and is heading for a strong breakout and retest.
We are seeing a rebound from the lower boundary of the descending channel, which is support at 16.80.
We have a downtrend on the RSI indicator that is ab

#EGLD/USDT#EGLD
The price is moving within a descending channel on the 1-hour frame and is expected to continue upward.
We have a trend to stabilize above the 100 moving average once again.
We have a downtrend on the RSI indicator that supports the upward move with a breakout.
We have a support area at th

MultiversX, Crypto, Stock Market, The World & Soul PsychologyThis is MultiversX in the transition period, between bear and bull market.
I don't know if you already know what I've been saying and sharing about the transition years, 2023 and 2024. Here I have the linear chart which clearly shows the difference between a bull market vs a sideways market.
After

EGLD Eyes Tactical Rebound from Structural SupportEGLD remains in a defined macro downtrend since its $544 ATH, but the current price action is reacting once again at a key lateral trendline that has historically triggered major bullish rebounds. The ongoing bounce from this structural support suggests a potential short-term rally toward the $40 re

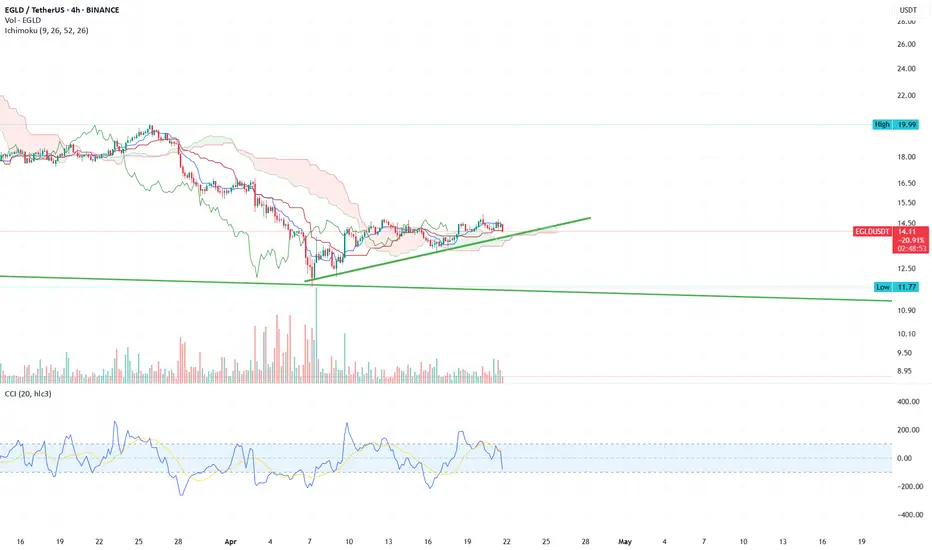
edld 📊 EGLD/USDT – 4H Technical Analysis
The price of EGLD/USDT is currently trading at $14.28, consolidating in a rising triangle pattern after a significant downtrend.
🔍 Key Observations:
Ascending trendline support is clearly holding since the April bottom, showing gradual higher lows.
Ichimoku Clou
EGLDUSDT 1D AnalysisEGLD ~ 1D Analysis
#EGLD Buy after successfully penetrating this resistant line with a short -term target of at least 10%+.

EGLD's situation+ Target PredictionThe EGLDUSDT is in a Bullish phase by a Falling Wedge Pattern.
-A falling wedge indicates the potential for price to reach to $23.
Note if the Wedge Pattern is broken downwards with the strength of Bearish candles , this analysis of ours will be failed.
Give me some energy !!
✨We spend hours findi

Max pain - Max gain II To be honest, I would never have expected EGLD to be at 13.8 at the same time BTC is at 83K. I will try to add some LEVERAGE at this point to boost my position.
I think in the worst case scenario we could retest the all-time low of $8 🤯
I'm not saying it will happen, I'm saying this could be the

EGLD is ready to hit $30 (Short Squeeze)CRYPTOCAP:EGLD just hit its weekly demand zone and is showing a good reaction its about time it goes to $30.

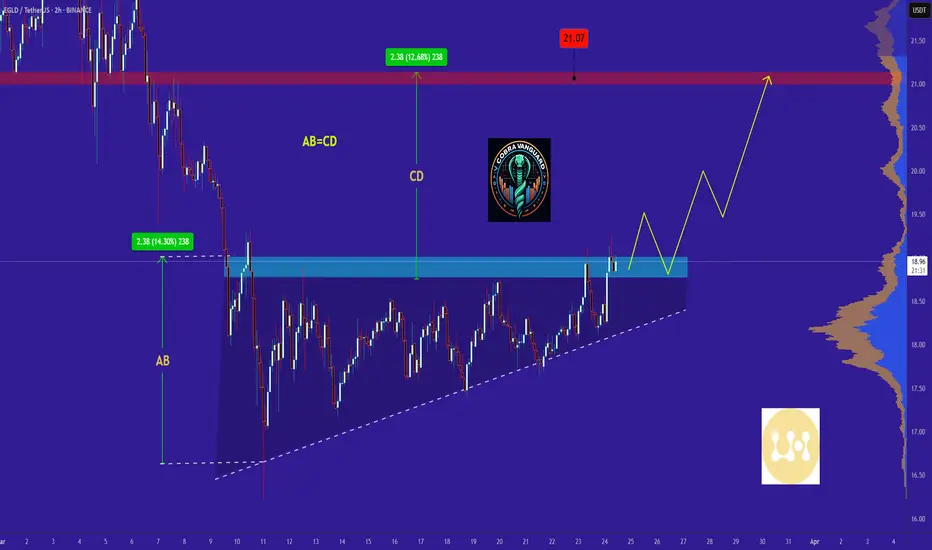
EGLD in coming days ...Currently, EGLD is forming an ascending triangle, indicating a potential price increase. It is anticipated that the price could rise, aligning with the projected price movement (AB=CD).
However, it is crucial to wait for the triangle to break before taking any action.
Give me some energy !!
✨We sp
See all ideas
Summarizing what the indicators are suggesting.
Oscillators
Neutral
SellBuy
Strong sellStrong buy
Strong sellSellNeutralBuyStrong buy
Oscillators
Neutral
SellBuy
Strong sellStrong buy
Strong sellSellNeutralBuyStrong buy
Summary
Neutral
SellBuy
Strong sellStrong buy
Strong sellSellNeutralBuyStrong buy
Summary
Neutral
SellBuy
Strong sellStrong buy
Strong sellSellNeutralBuyStrong buy
Summary
Neutral
SellBuy
Strong sellStrong buy
Strong sellSellNeutralBuyStrong buy
Moving Averages
Neutral
SellBuy
Strong sellStrong buy
Strong sellSellNeutralBuyStrong buy
Moving Averages
Neutral
SellBuy
Strong sellStrong buy
Strong sellSellNeutralBuyStrong buy
Displays a symbol's price movements over previous years to identify recurring trends.
Curated watchlists where EGLDUSDT.PS is featured.

Proof of Stake: Seeking validation?
26 No. of Symbols

Smart contracts: Make the smart decision
36 No. of Symbols
See all sparks