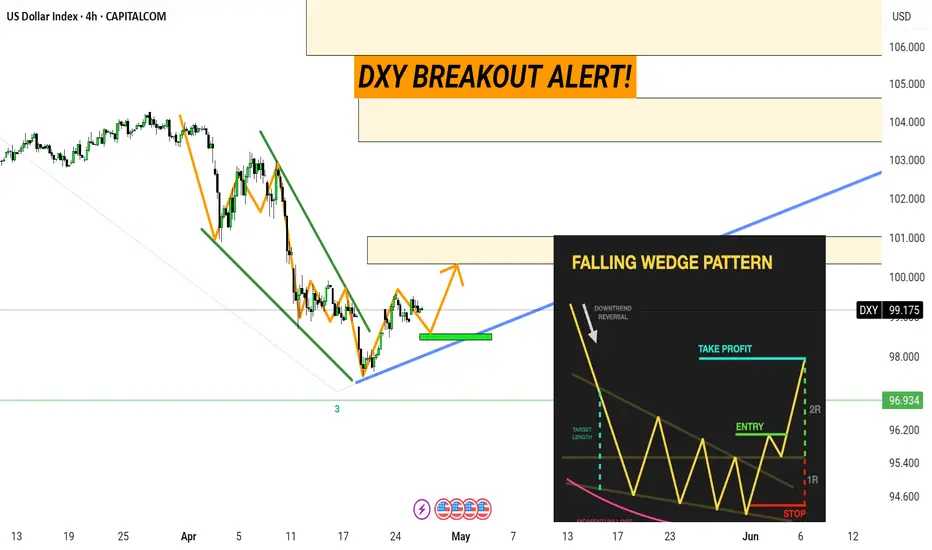
DXY BREAKOUT IN PLAY — Smart Money is Moving!After a clean falling wedge formation, DXY is showing early signs of bullish momentum.
Price action respects the trendline support + bullish orderblock (green zone) beautifully!
Next targets: 101.000 — 103.000 zone.
Watch for pullback entries before continuation.
This is textbook falling wedge breakout behavior — stay sharp!
Levels Marked:
Support: 99.00 zone
Target Zones: 101.000 & 103.000
Breaker structure: Confirmed bullish
Save this setup & be prepared!
USDX trade ideas
DXY Dxy has some more upside, let the market go above 100 and then we will see the reaction.
Disclosure: We are part of Trade Nation's Influencer program and receive a monthly fee for using their TradingView charts in our analysis.

Bullish week forecast for DXYWeekly showing price taking low and closing above it, leaving a rejection candle
Daily showing a potential internal to external range move

DXY 4H Chart AnalysisThe U.S. Dollar Index is currently consolidating near the 99.400 level, within a broader bearish trend. Price is sitting just above key H4 support (~99.000), making this a critical decision zone.
Bullish scenario: Rejection from 99.000 could lead to a retracement towards 100.000, and potentially 102.500 if momentum holds.
Bearish scenario: A break below 99.000 would confirm further downside, possibly targeting 97.500 and beyond.
Traders should wait for clear price action confirmation before committing to a direction.

DXY TrendlinesUnless it brakes the downtrend with a weekly candle close it should bounce back up in long run. should be closely monitored since it will give us a lot of information about current market direction. i expect bouncing back up but we will see.

$USD Breaks Down – “Mission Accomplished” or Just Getting📉 The US Dollar Index ( AMEX:USD / TVC:DXY / $USINDEX) has officially broken beneath the multi-year support zone from 2020, right as Trump prepares to declare "Mission Accomplished".
From Inauguration to Liberation Day, and now the final stage: Meltdown.
🧭 Key Events Marked:
🟥 Inauguration
🟥 Trade War
🟥 Liberation Day
🟩 Mission Accomplished
🔻 Meltdown incoming?
📊 The breakdown aligns with a sharp spike in Nasdaq down volume (see chart). This isn't just a currency move — it's a market-wide stress signal.
Watch closely:
TVC:DXY below 99 = structural weakness.
Risk-on assets may melt up temporarily, but volatility could snap back fast.
Global currency pairs ( FX:EURUSD , FX:USDJPY , FX:GBPUSD ) are all on alert.

DXY: Will Go Up! Long!
My dear friends,
Today we will analyse DXY together☺️
The market is at an inflection zone and price has now reached an area around 98.933 where previous reversals or breakouts have occurred.And a price reaction that we are seeing on multiple timeframes here could signal the next move up so we can enter on confirmation, and target the next key level of 99.097.Stop-loss is recommended beyond the inflection zone.
❤️Sending you lots of Love and Hugs❤️

Dollar Index - Short Term Relief Rally Upcoming?From the beginning of 2025, it's been nothing but pain in the markets; bearish prices on bearish prices and it's not looking like it's the ends.
But wheat happens when the market is trading one way for a long time is you tend to have short squeezes. This is where traders place and trail their stop losses above recent highs with the expectation that the market will not reverse back into the highs before continuing lower.
I believe something like this can play out this week It all depends on Sundays opening....

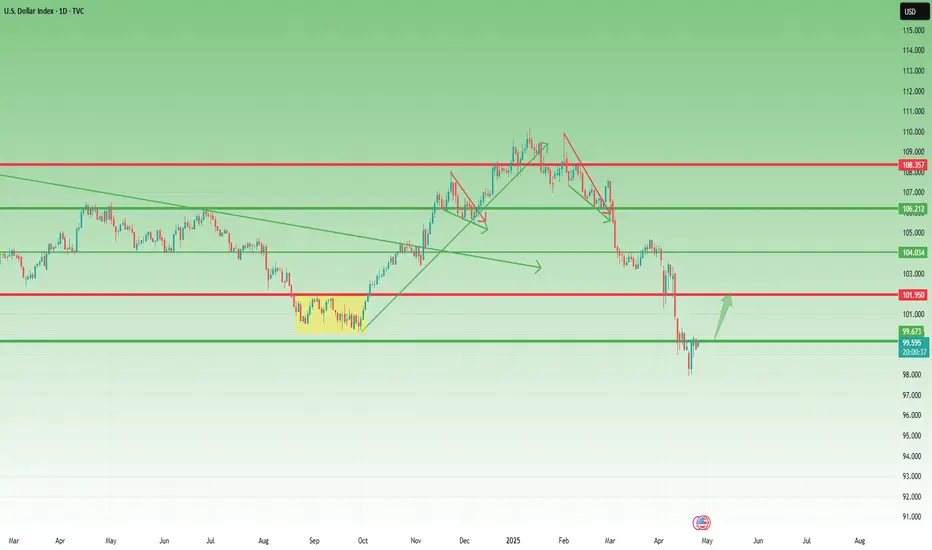
DOLLARThe U.S. Dollar Index (DXY) is currently in a bearish phase, trading near 98.93 as of late April 2025, down from 99.71 earlier in the month. Key drivers include:
Political Uncertainty: Trump’s tariff policies (e.g., 25% levies on auto/semiconductor imports) and trade tensions have eroded the dollar’s safe-haven appeal, despite initial short-lived gains.
Fed Policy Expectations: Markets anticipate Fed rate cuts in 2025 if inflation cools, weakening the dollar. The Fed’s cautious stance in recent minutes has reinforced this outlook
Rising Treasury yields reflect inflation concerns and foreign selling, yet the DXY has weakened due to political risks and growth fears.
Basis trades (exploiting price gaps between Treasuries and derivatives) have amplified volatility, with an estimated $800B– MIL:1T at stake.
Divergence Signals:
The DXY-Treasury spread (usually correlated) has diverged, suggesting markets doubt the Fed’s ability to sustain higher rates despite sticky inflation. This divergence often precedes shifts in risk asset pricing.
Fed Policy Impact:
Fed minutes emphasize data dependency, delaying rate cuts until inflation eases convincingly. However, bond markets are pricing in 1–2 cuts by year-end, weakening the dollar.
Outlook and Critical Levels
Bond Yields: Likely to stabilize near 4.5% for 10-year Treasuries if inflation moderates, but geopolitical risks and tariff escalation could drive further volatility.
Conclusion
The DXY’s bearish bias persists amid political uncertainty and Fed dovishness, while bond markets face turbulence from inflation and foreign capital flows. Traders should monitor:
Fed rhetoric and U.S. inflation data (core PCE, CPI).
Geopolitical developments (U.S.-China trade talks, tariff adjustments).
This interplay suggests continued volatility, with the DXY likely to underperform unless Fed policy or risk sentiment shifts abruptly.

USXUSD HOTW FrameworkUSXUSD HOTW Framework
Expansion delivery from Wednesday onwards.
April Lows Target, Previous Monthly Low by the time we will see the expansion occur.
Let's see if Medz is right once again

DXY, big picture analysisTechnical analysis for DXY.
Looking for bottom about 89.209 to complete wave B of zigzag (Y).
Would then look for wave C of (Y) to break above 121.020 resistance (bearish pitchfork never tagged median line).

DXYU.S Dollar Index
- Completed " 12345 " Impulsive Waves and " AB " Corrective Waves
- Break of Structure
- Resistance Level
- Consolidation Phase
- Order Block

Bullish USIndexCurrently looking at inverted H NYSE:S and also inside channel trading which might also serve as bull flag pattern once broken to the upside. This would mean gold wil be bearish

DXY start monthly bearish trend monitoring 94.8DXY start monthly bearish trend monitoring 94.8
whoever hate Trump tarif could just dump the dollar
it's a monthly bearish trend, need 1 or 2 year to go back to above 100
make cheap dollar, lower interest rate
will see a lot of new debt and print money before dollar fly again

DXY ... Dollar Index looks not as clean Gann reviewNot too much to explain here...just see the highlighted areas and see that the Gann box Stacking strikes again with some interesting levels. The light angles are kinds nice, but the most recent one where the price is now seems to be the only thing holding it back from being a green face smash to 96...
Mor Tariff... Mor pain for the Dolla Dolla Bill y' all
This is the larger picture and see as to how I come to these Gann box alignments:
Again...You just find pivots and span them with the box- then stack or slide them with points all being contiguous and you have your price action analysis.
Above chart is the weekly. Just imagine if there was any significance to the 2001 high and then the 2008 lows when it comes to geopolitics or financial situations....one could say:
Its almost like a twin peak, one with a tower on it, just suddenly got hit out of nowhere and then crashed down to the Great Financial Center down below..hmmm VV

DXYThe US Dollar Index (DXY) is showing a downward trend as institutional investors continue to prioritize selling over buying. This sentiment is reflected in the increasing number of sell orders compared to buy orders.
Key Observations:
- DXY price action indicates a bearish trend.
- Institutional investors are adding more sells than buys, contributing to the downward pressure.
Trading Implications:
- Short positions may be favored given the prevailing bearish sentiment.
- Traders should monitor key support levels for potential breakouts or reversals.

My Thoughts #001Here is an idea 💡
I just think the pair is set to push higher...
Because the pair then went and made a Choch and meaning that we are moving from bearish pattern to bullish pattern
Anything could invalidate my set up
So use proper risk management
Let's do the most

My Thoughts #001Here is an idea 💡
I just think the pair is set to push higher...
Because the pair then went and made a Choch and meaning that we are moving from bearish pattern to bullish pattern
Anything could invalidate my set up
So use proper risk management
Let's do the most

DXYThe U.S. Dollar Index (USDX or DXY) is a measure of the value of the U.S. dollar relative to a weighted basket of six major foreign currencies: the euro (57.6% weight), Japanese yen (13.6%), British pound (11.9%), Canadian dollar (9.1%), Swedish krona (4.2%), and Swiss franc (3.6%). Established in 1973 after the Bretton Woods system ended, the index serves as a benchmark for the dollar’s strength in global markets.
How the Dollar Index Drives Trade Directional Bias in Forex
Indicator of Dollar Strength or Weakness
When the USDX rises, it means the U.S. dollar is strengthening against this basket of currencies; when it falls, the dollar is weakening. Since the dollar is the world’s primary reserve and trading currency, its strength heavily influences forex market trends.
Correlation with Major Currency Pairs
Inverse correlation with EUR/USD and GBP/USD: Because the euro and pound have large weights in the index, a rising USDX typically causes EUR/USD and GBP/USD to fall, and vice versa.
Positive correlation with USD/JPY and USD/CAD: For pairs where USD is the base currency, these pairs tend to move in the same direction as the USDX.
Commodity-related pairs like AUD/USD and NZD/USD often move inversely to the USDX due to their sensitivity to global risk sentiment and commodity prices.
Guiding Trade Decisions and Confirming Signals
Traders use the USDX to confirm directional bias in forex trades. For example, if the USDX is rising, it supports taking long positions in USD-based pairs or short positions in pairs where USD is the quote currency. Conversely, a falling USDX suggests caution on USD longs and potential opportunities in other currencies.
Macro and Sentiment Indicator
The USDX reflects broader economic conditions, U.S. monetary policy, and global risk sentiment. For instance, Fed rate hikes often strengthen the USDX, causing shifts in forex markets. It also acts as a proxy for the health of the U.S. economy and influences global trade flows.
Summary
Aspect Effect on Forex Trading
Rising USDX Dollar strengthens; EUR/USD & GBP/USD tend to fall; USD/JPY & USD/CAD tend to rise
Falling USDX Dollar weakens; EUR/USD & GBP/USD tend to rise; USD/JPY & USD/CAD tend to fall
USD as Base Currency (USD/xxx) Moves in line with USDX
USD as Quote Currency (xxx/USD) Moves inversely to USDX
Use in Trading Confirms trade signals, guides directional bias, gauges macroeconomic trends
In essence, the U.S. Dollar Index is a vital tool in forex trading, providing a consolidated view of the dollar’s strength and helping traders anticipate market movements and set trade directional bias accordingly.

DXY USD INDEX FORECAST Q2 W18 Y25DXY USD INDEX FORECAST Q2 W18 Y25
Professional Risk Managers👋
Welcome back to another FRGNT chart update📈
Diving into some Forex setups using predominantly higher time frame order blocks alongside confirmation breaks of structure.
✅ U.S. dollar index is a measure of the value of the dollar against a basket of six foreign currencies.
✅The currencies are the Euro, Swiss franc, Japanese yen, Canadian dollar, British pound, and Swedish krona.
💡Here are some trade confluences📝
✅ Break an d close below July 2023 key 100.00 levels.
✅ Foresee a pull back to, weekly imbalance, daily order block, daily 50ema, weekly order block and or weekly 50 ema.
✅ Awaiting to identify a significant break of structure bullish to use the DXY as confluence for our trading week 18 of Q2 toward key points of interest mentioned above.
✅ Forecasting continued bearish pressure long term.
✅Initially bullish outlook however upon price turn around. DXY to break 100.000 level again.
🔑 Remember, to participate in trading comes always with a degree of risk, therefore as professional risk managers it remains vital that we stick to our risk management plan as well as our trading strategies.
Pairs to look out for -
EURUSD
USDCHF
USDJPY
USDCAD
GBPUSD
📈The rest, we leave to the balance of probabilities.
💡Fail to plan. Plan to fail.
🏆It has always been that simple.
❤️Good luck with your trading journey, I shall see you at the very top.
🎯Trade consistent, FRGNT X

Make US(and USD) weak again, and short DXY 99,358Hey traders, this is a fundamentally and technically based idea. I´m expecting a weakening of USD due to actual US goverment policy. Important weekly lenel 100,600 was broken and holding. If you decide to trade this idea, you can enter now at current price 99,358 and hold till profit lines. TP your trade partially. You can consider averaging at 100,600 instead of cutloss after the reaction. Wish you good luck.

USD Index: A Possible Reversal in Sight?Since early February, right after Trump’s inauguration, the USD Index (DXY) has been under pressure, falling sharply by over 10%.
However, after hitting the 98.00 level, things seem to have stabilized. We're seeing the early signs of a relief rally.
🔍 Technical Perspective:
- This week’s candlestick pattern suggests a bullish reversal.
- The dip on Wednesday was quickly bought, showing buyer interest.
- A minor correction occurred yesterday, but dips are being well supported.
- Currently, the DXY trades around 99.60, just under the psychological level of 100.
🎯 Outlook:
As long as 98 remains intact, the bias shifts towards a potential rebound.
First target: 102 – a logical resistance zone and prior support.
This is not yet a confirmed trend reversal, but the price action is shifting. The key now is how the market reacts around the 100 level. A break above could trigger further bullish momentum.
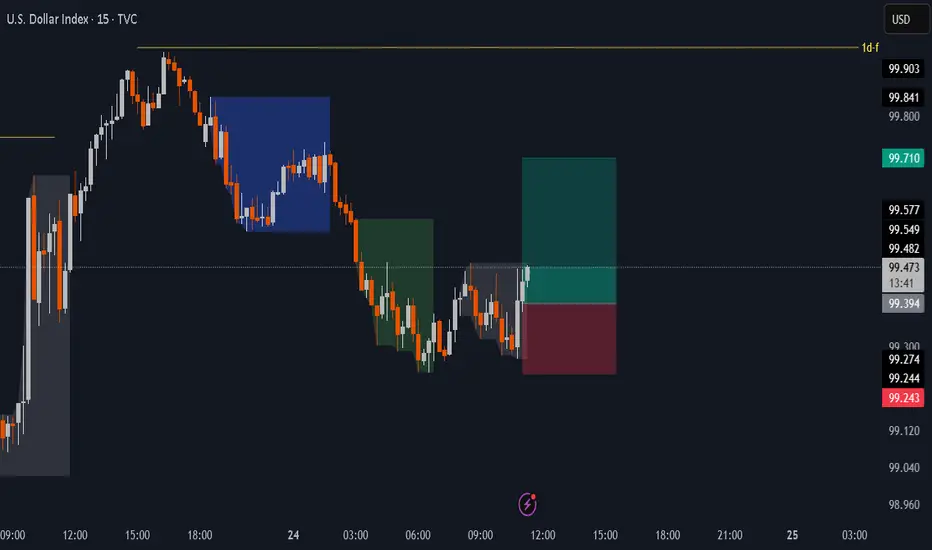
DXY BUYSWING IS CLEARLY BULLISH (1D AND 4H )
this is kinda intra-day setup . which show clear choch on 15min
now whether wait for tomorrow kill-zone session , or enter from now .
xxx/usd bearish.