EOS/USDTEOS/USDT
It has formed a descending angle pattern in the four-sate time frame.
Due to the rising divergence that has formed, the price can increase.
The targets are clear in the picture.
#EOS #EOSUSDT #BTC #BTCUSD #LUNA #LUNC #UST
EOSUSDT.P trade ideas


EOSUSDT | HOLDING IMPORTANT LEVELEOSUSDT has been in a bullish trend.
Currently, the price is trading near rising support which is well respected by price previously.
The bulls are in control as long as price is trading above rising support.
Trade your levels accordingly.

#EOSUSDT 12H Chart
Price recently took out the equal lows and it is now close to tapping into the major 12h demand zone. MACD is showing bearish weakness, RSI is sold and EMAs are bearish. I expect price to tap into this demand and move up from there towards the daily supply zone.


EOS/USDT Long📈15minN.B. My strategy is based on huge explosive profit or very little profit so without breakeven stop loss at the right time we will lose in very little profit so follow me if you want to know breakeven stop loss
Trading proposals post based on price action,
technical analysis, major intraday supports
and resistances, rejections, breakouts, chart
patterns and other factors.
How this analysis was done:
First I find usdt pairs using crypto screener then if all Three×3 in 1 indicators gives main entry confirmation at the same time I go with the analysis then I find Support and Resistance zones in 3x entry timeframe also using one of the three indicators for backing up my analysis and filter bad signals then I also make trendlines using two of the 3 indicators in 3x entry timeframe for filter out more bad signals then again using one of the 3in1 indicators I filter fake breakout in entry timeframe and in higher time frame and then if other minor conditions is confirmed the analysis is done.
Take Profit:
Take profit is dynamic/trailing stop loss/take profit
Trading and investment in the financial
markets always involves high risk, So In order
to succeed using our signals make sure you
have learned the essential skills for money and
risk management
To SUPPORT this channel, please press the
LIKE button, COMMENT and Share with your
friends

EOS/USDTeos/usdt buy at current price
stoploss at 1.212
our target will be 1.338 almost 8 to 9%
so let's see what happen next

EOS/USDT is at important level!Morning colleagues!
EOS/USDT looks about to have some major movement here. At the moment it is testing the next zone of trend line so lets see what will happen at this zone. We will be waiting for confirmation of movement and once we are confident we will enter with trades as well!
If you like ideas provided by our team you can show us your support by liking and commenting.
Yours Sincerely,
Swallow Team 🔱
Disclamer:
We are not financial advisors. The content that we share on this website are for educational purposes and are our own personal opinions.

EOS CAN MAKE A CORRECTIONFrom the specified area, he can make a workhorse. Set a stop and look at the chart

The Doubble Top Formation On EOSImportant Fibonacci Levels:
-0,89
-1,09
-1,25
-1,36
-1,47
-1,60
-1,84

EOSUSDT 4H - AB=CD pattern at 0.61 fib retracementWe have a perfect AB=CD pattern at the 0.61 fib retracement and channel.
Price already reacting to the PRZ
Please like and follow.
Happy trading.
Best Regards.

EOSUSDT Analysis (LOCAL VISION)Hello friends.
Please support my work by clicking the LIKE button👍(If you liked). Also i will appreciate for ur activity. Thank you!
Everything on the chart.
Entry: market
Target zone: 1.3 - 1.2
after first target reached move ur stop to breakeven
Stop: ~1.9 (depending of ur risk). ALWAYS follow ur RM .
Risk/Reward: 1 to 2
risk is justified
Good luck everyone!
Follow me on TRADINGView, if you don't want to miss my next analysis or signals.
It's not financial advice.
Dont Forget, always make your own research before to trade my ideas!
Open to any questions and suggestions.

eos market updateThe bottom of the long-term descending channel is around 0.8. This area is considered as a potential trend change area. If this area fails, it will not rise for long

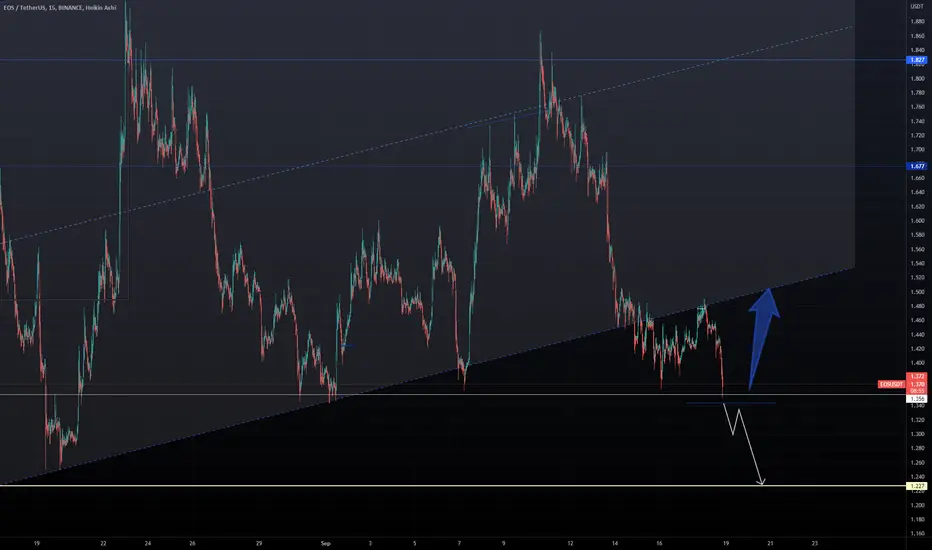
EOS- Updated chart and LevelsEOS has failed to break back into ascending channel and a dip to support at 1.356 might offer us a good trading opportunity for a short-term trade.
I would be out at 1.344 and know that the next level would be 1,227
Let's see how markets open in Asia this morning.. scary given that Fed rate hike is coming next.
One Love,
THE FXPROFESSOR
EOS/USDTEOS/USDT
It is on a very important support.
In my opinion, there is a possibility of price support in the area and it can increase the price up to the area of 1.8 dollars.
#EOSUSDT #EOS #BTCUSDT #BTC #ETHUSDT #DOGE #DOGEUSDT

EOSUSDT | SETUPEOSUSDT after making a double top has been in downtrend and found a support at horizontal zone. The price took support and bounced back. The price on shorter time frame has made a double bottom pattern too. The bullish candles on support projects bulls can take control and may break the resistance. The price is trading near the falling resistance.
The bulls need to break above the falling trendline.
Trade your levels accordingly.

EOSUSDT | LongAfter the publication of the US CPI data, the indexes and also the crypto market fell. However, EOS maintained its support floor and only fell in the corrective areas. But the important point is this week's news. which can cause a lot of fluctuations.be profitable🤑

Eos trend correction?The decrease in trading volume in eos coin and the formation of twin peaks in the 1-day chart can lead to a price drop to the $1 range, but for the transaction, the price is $1.22.
TIME : 1 days
SIDE : SELL
BUY 0r SELL ZONE : 1.425
TAKE PROFIT : 1.22
STOP LOSS : 1.573
R/R = 1.45
MIDTERM SIGNAL
#CRYPTO
#EOS

EOS | A Bounce From The Pattern May Occur AgainEOS | A Bounce From The Pattern May Occur Again
Price is testing a very strong support area that was tested several
the time during the last months.
The support area located near 1.3670 can push the price up again.
The first resistance will be the first structure that is near 1.8497 and
the next one is the upper part of the bigger structure near 2.7560
Targets:
🎯 1.8497
🎯 2.7560
Thank you and Good Luck!

EOS/USDT is sitting at important lvlHey, traders
We are back with EOS coin. Not much to say for now, we are sitting at trend-line support where we need a confirmation either bulls or bears will secure this zone.
This looks great setup for us and we will take actions only once we get confirmation of our direction!
If you like ideas provided by our team you can show us your support by liking and commenting.
Yours Sincerely,
Swallow Team 🔱
Disclamer:
We are not financial advisors. The content that we share on this website are for educational purposes and are our own personal opinions.

EOSUSDT LONG (2HRS SCALP)Enter the trade after a bull candle bar closes above the line (enter trade), set your stop loss on the line (SL) and take profit using the line (TP1, TP2) or you can adjust your stop loss to take more profit. Thank you.
Note:
1. Do not enter trade if the Candlestick crosses the line, enter only if it closes above, and the next Candlestick is a Bull bar.
2. Remember your risk management or risk ratio, to avoid blowing your account.
3. Wishing you a safe trade.

EOS CAN MOVE DOWN AGAINFrom the point of view of Neowave, we have a neutral triangle, which is in wave E
In terms of price action, after an upward lag, we can have a strong downward movement

EOSUSDT BATBat
The Bat Pattern is a 5-point retracement structure that was discovered by Scott Carney in 2001. It has specific Fibonacci measurements for each point within its structure and it is important to note that D is not a point, but rather a zone in which price is likely to reverse, called the Potential Reversal Zone (PRZ). The B point retracement of the primary XA leg must be less than a 0.618, preferably a 0.50 or 0.382 and the PRZ consists of 3 converging harmonic levels: 1) 0.886 retracement of the primary XA leg, 2) extended AB=CD pattern, usually 1.27 AB=CD and 3) minimum BC projection is 1.618.
The first target would be the 382 retracement of AD and the second target the 618 retracement of AD. A common stop level would be behind the X-point. Conservative traders may look for additional confirmation. Bat Patterns can be bearish and bullish. TradingView has a smart XABCD Pattern drawing tool that allows users to visually identify 5-point reversal structures on a chart.
