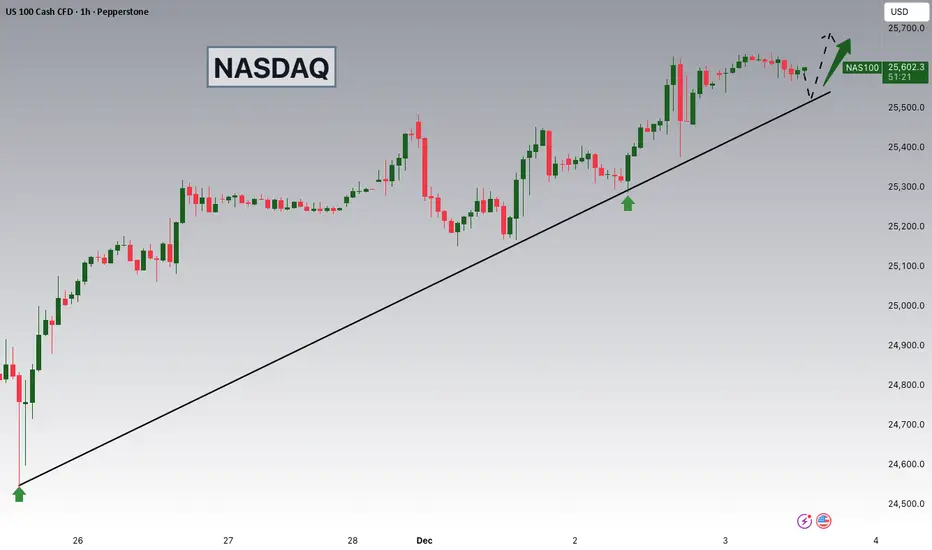
NASDAQ Potential UpsidesHey Traders, in today's trading session we are monitoring NAS100 for a buying opportunity around 25,520 zone, NASDAQ is trading in an uptrend and currently is in a correction phase in which it is approaching the trend at 25,520 support and resistance area.
Trade safe, Joe.
Trade ideas
USNAS100 consolidating within a bearish trendThe USNAS100 is currently consolidating within a bearish trend. Wall Street’s main indexes are expected to open lower on Monday as investors move to the sidelines ahead of key economic data and a closely watched speech from Federal Reserve Chair Jerome Powell. Markets are looking for clues regarding the Fed’s policy direction later this month.
From a technical perspective, US100 remains vulnerable to further downside If price closes below 24,990 and holds beneath this level, bearish momentum is likely to continue. In that scenario, the next support zones lie at: 24,800 TO 24,200
You may find more details in the chart.
Trade wisely best of luck buddies.
Ps; Support with like and comments for better analysis Thanks for supporting.

NASDAQ Santa Rally already underway.Nasdaq (NDX) has made a strong V-shaped recovery on its 1D MA100, as projected on our previous analysis and is extending the uptrend above the 4H MA200 (orange trend-line).
The rally may need a relief pull-back towards its 4H MA50 (blue trend-line) but technically, the seasonal end-of-the-year 'Santa Rally' is already underway.
V-shaped recovery and Inverse Head and Shoulders patterns typically target their 2.0 Fibonacci extensions. That is currently at 26600.
---
** Please LIKE 👍, FOLLOW ✅, SHARE 🙌 and COMMENT ✍ if you enjoy this idea! Also share your ideas and charts in the comments section below! This is best way to keep it relevant, support us, keep the content here free and allow the idea to reach as many people as possible. **
---
💸💸💸💸💸💸
👇 👇 👇 👇 👇 👇

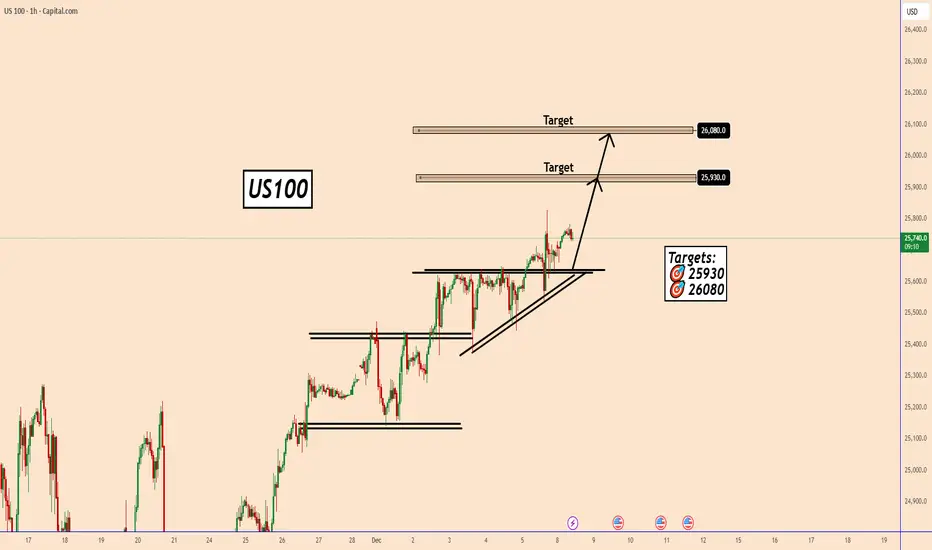
US100: Nasdaq 100 Maintains Bullish Structure Into Fed WeekUS100: Nasdaq 100 Maintains Bullish Structure Into Fed Week
US100 remains in a bullish structure for now. The price has broken out of the triangle pattern, signaling an increase in bullish momentum.
With market optimism still high regarding a potential FED rate cut, the probability of further upside remains elevated.
However, with the FOMC meeting approaching, volatility is expected to rise significantly. This makes short-term targets more reasonable, as market behavior can shift quickly once speculation around the news intensifies.
Short-Term Targets:
🎯 25,930
🎯 26,080
You may find more details in the chart!
Thank you and Good Luck!
❤️PS: Please support with a like or comment if you find this analysis useful for your trading day❤️
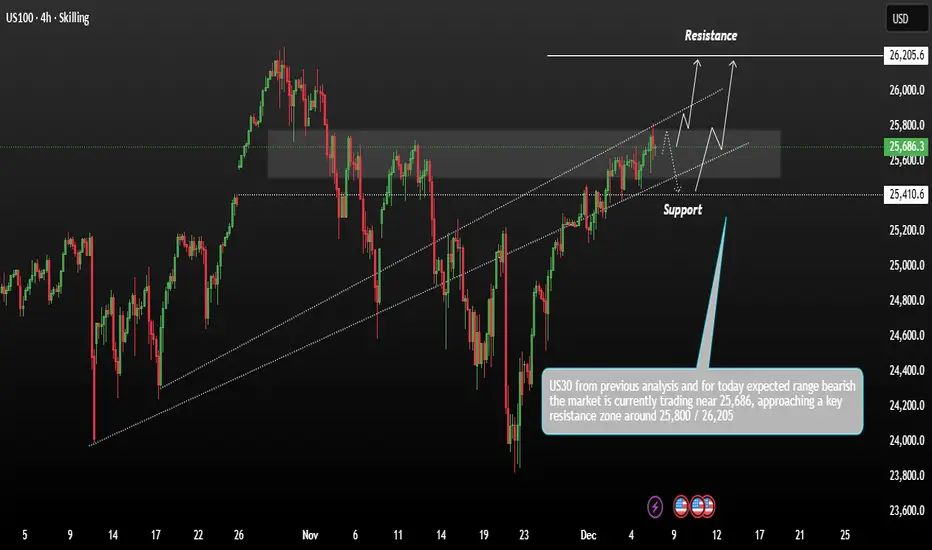
USNAS100 Consolidation Positive Holds Strong range momentumUS100 shows price action moving within a rising channel after recovering from previous lows. The market is currently trading near 25,686, approaching a key resistance zone around 25,800 – 26,205. This area has been marked as the upper boundary where price may face rejection or potentially break out.
Technically US Stocks closed out the trading week with slight gains on Friday as the latest flurry of economic data kept elevated expectation for federal reserve interest rate cut next week intact,
Remember if Price could hold above support and continue upward along the upper channel, targeting the major resistance at 26,205 Price may dip back into the support zone before attempting another move upward.
You may find more details in the chart,
Trade wisely best of luck buddies.
Ps; Support with like and comments for better analysis thanks for supporting.
Tech bubble burst?The Head and Shoulders (H&S) pattern is a classic reversal formation, typically found after a mature uptrend. It represents a gradual loss of buying pressure and a transition toward a potential downward move.
The H&S pattern often signals the exhaustion of bullish momentum, a shift in control toward sellers, and the possible beginning of a deeper reversal (sell-off).

Nasdaq - The final blow-off top!⚰️Nasdaq ( TVC:NDQ ) can rally a final +25%:
🔎Analysis summary:
Just this month, we witnessed quite some volatility on the Nasdaq with a correction of about -10%. However, bulls immediately stepped in and clearly pushed price higher. Since there is still bullish pressure, a final blow-off top rally in the near future is quite likely.
📝Levels to watch:
$25,000 and $30,000
SwingTraderPhil
SwingTrading.Simplified. | Investing.Simplified. | #LONGTERMVISION

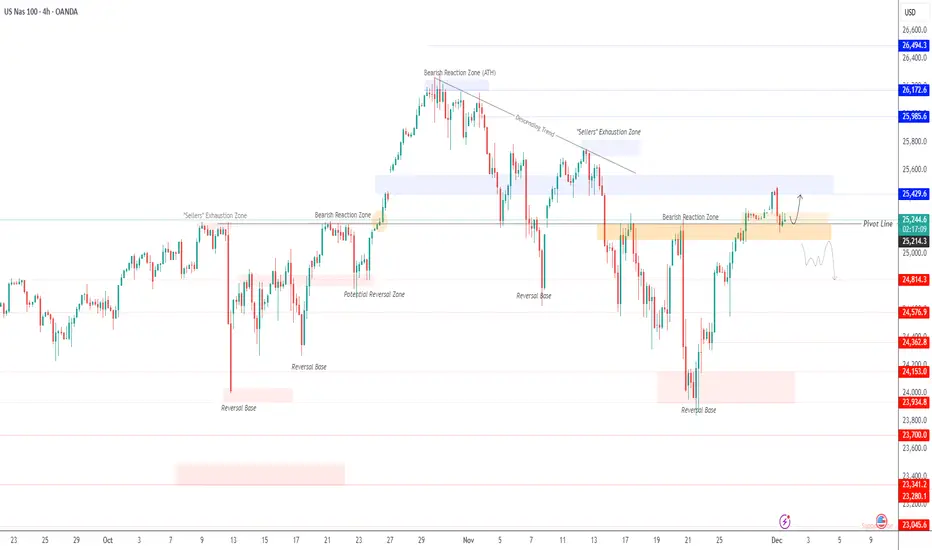
USNAS100 | Momentum Builds Above Key PivotUSNAS100 – Technical Overview
USNAS100 is showing signs of stability above the pivot line at 25730.
As long as the price holds above this level, bullish momentum is expected to continue toward 25880 and 25980, with potential extension toward 26200.
However, a 1H or 4H candle close below 25730 will activate bearish momentum, opening the way toward 25570 and 25430, with deeper downside possible into 25210 if selling pressure increases.
Key Levels
Pivot Line: 25730
Resistance: 25880 · 25980 · 26200
Support: 25570 · 25430 · 25210

US100 / NASDAQ TodayNasdaq 100 (NDX) Analysis - December 3, 2024
Based on today's market data, here's a comprehensive analysis of the Nasdaq 100:
Today's Performance
The Nasdaq 100 is currently trading around 25,513 points. The index closed at 25,555.86, gaining 213.01 points (+0.84%) as of 5:16 PM EST on December 2.
Today's Trading Range:
Opening: 25,449.87
High: 25,622.58
Low: 25,369.36
Volume: 380,862,001
52-Week Performance
Over the past 52 weeks, the index has ranged from 16,542.20 to 26,182.10, representing an 18.91% gain over the past 12 months.
Technical Signals
Based on technical indicators and moving averages, the daily buy/sell signal is "Strong Buy".
2024 Performance Context
The Nasdaq-100 finished 2024 higher by 25% following a return of nearly 54% in 2023—its best two-year stretch since 1998 and 1999—and eclipsed 20,000 for the first time.
However, December saw a reversal with approximately three out of every five indexes experiencing losses, averaging down 4.0%. This followed the Fed's hawkish tone, as it reduced the number of expected rate cuts in 2025 to two from four.
Recent Index Reconstitution
On December 13, 2024, Nasdaq announced that Palantir Technologies, MicroStrategy, and Axon Enterprise will be added to the index effective December 23, 2024, while Illumina, Super Micro Computer, and Moderna will be removed.
Market Context
The index is currently navigating a period of consolidation after reaching near-record highs. Key factors influencing the market include Federal Reserve interest rate policy, valuations of mega-cap tech stocks (particularly the "Magnificent 7"), and ongoing developments in AI technology.
DISCLAIMER: This analysis is for informational purposes only and should not be considered financial advice. Trading in financial instruments involves significant risk, including the potential loss of principal. Past performance does not guarantee future results. Market conditions can change rapidly, and the information provided may not reflect real-time market movements. Always conduct your own research and consider consulting with a qualified financial advisor before making any investment decisions. The author is not a financial advisor and assumes no responsibility for any investment decisions made based on this analysis.

NAS 100Am bullish until the target high is swept. I'll drop any lowertimeframe buys when I spot one.


Trump It...Think we're close to completing this bull trap before we slide down lower - Q the free fall.


NASDAQ formed its 1st 4H Golden Cross in 7 months!Nasdaq (NDX) completed last Friday its first 4H Golden Cross formation in more than 7 months (since May 01). This is taking place while the index is inside a Channel Up, making a V-shaped recovery from the November 21 Low.
The last time all the above conditions were fulfilled was exactly during the May Golden Cross. With the 4H MA200 (orange trend-line) as its Support, the index eventually hit its previous All Time High (ATH).
As we've entered the Fed week, we can finally see this move to the ATH Resistance, so our short-term Target on Nasdaq remains 26200.
---
** Please LIKE 👍, FOLLOW ✅, SHARE 🙌 and COMMENT ✍ if you enjoy this idea! Also share your ideas and charts in the comments section below! This is best way to keep it relevant, support us, keep the content here free and allow the idea to reach as many people as possible. **
---
💸💸💸💸💸💸
👇 👇 👇 👇 👇 👇

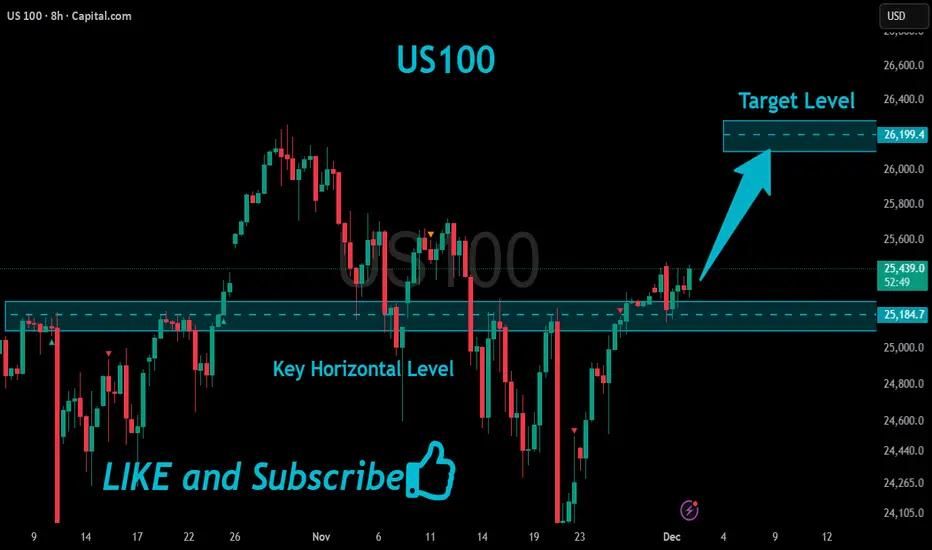
US100 Bullish Breakout!
HI,Traders !
#US100 is going up now
And made a bullish
Breakout of the key horizontal
Level of 25184.7 and the breakout
Is confirmed so we are bullish
Biased and we will be
Expecting a further
Bullish move up !
Comment and subscribe to help us grow !
Market Hunter: NASDAQ-NAS100 Sell OpportunityMy friends, Good morning!☀️
For US100-NAS100, I will open a SELL position between 24,988 and 25,243, targeting 23,843.📊
My friends, I share these analyses thanks to every single like I receive from you.
Your likes increase my motivation and make me want to support you in this way.🙏
I sincerely thank all my friends who support me with their likes.❤️

US100: Bullish Breakout Confirmed, But...US100: Bullish Breakout Confirmed, But a Healthy Pullback Is Needed
I would like to see a correction before buying US100
US100 has recently confirmed a Descending Broadening Wedge breakout, a pattern that typically signals the resumption of a strong bullish trend.
However, we are still in a low-liquidity moment, which often causes unpredictable spikes and pullbacks. For that reason, I prefer to wait for a correction before entering long positions, rather than chasing the price at the current levels.
For traders who believe US100 could continue upward immediately, long-expiration CALL Options may be a safer alternative.
These options help reduce the impact of intraday volatility and erratic movements caused by the thin market conditions.
Key Resistance Levels to Watch
25,715
26,165
27,000
27,500
You may find more details in the chart!
Thank you and Good Luck!
❤️PS: Please support with a like or comment if you find this analysis useful for your trading day❤️

USNAS100 | Watching 25740 After Resistance ReactionUSNAS100 – Technical Overview
USNAS100 has already reached the 25730 resistance highlighted in the previous analysis.
For today, the index is expected to trade with bearish momentum while below 25740, with price likely to test 25570.
A 1H close below 25570 is required to confirm continuation of the bearish trend toward 25430.
However, if the market closes a 1H candle above 25740, bullish momentum will return, opening the way toward 25980 and higher resistance levels.
Key Levels
Pivot Line: 25740
Resistance: 25880 · 25985 · 26170
Support: 25570 · 25470 · 25330
previous idea:

USNAS100 | Fed Uncertainty & Data Releases Drive Market SetupUSNAS100 – Technical Overview
Risk assets are showing renewed signs of recovery on Wednesday after the broad selloff that began the month, though bonds continue to hold their recent losses.
The U.S. dollar is also easing as attention shifts back to the Federal Reserve, with markets reacting to President Trump’s decision to delay naming the next Fed Chair until 2026.
With the November Nonfarm Payrolls report still pending, investors will closely watch today’s data releases for direction:
Key Events Today
- ADP National Employment Report (November)
- U.S. Industrial Production (September)
- ISM Services PMI (November)
- S&P Global Services & Composite PMIs (Final, November)
Technical Analysis
USNAS100 maintains bullish momentum as long as the price trades above 25570, with upside targets at 25730 and 25980.
A breakout above 25980 could extend the rally toward 26170.
However, a 1H close below 25570 will trigger a corrective move toward 25430, with deeper downside potential into the 25210 support zone.
Key Levels
Pivot Line: 25570
Resistance: 25730 · 25980 · 26170
Support: 25430 · 25210

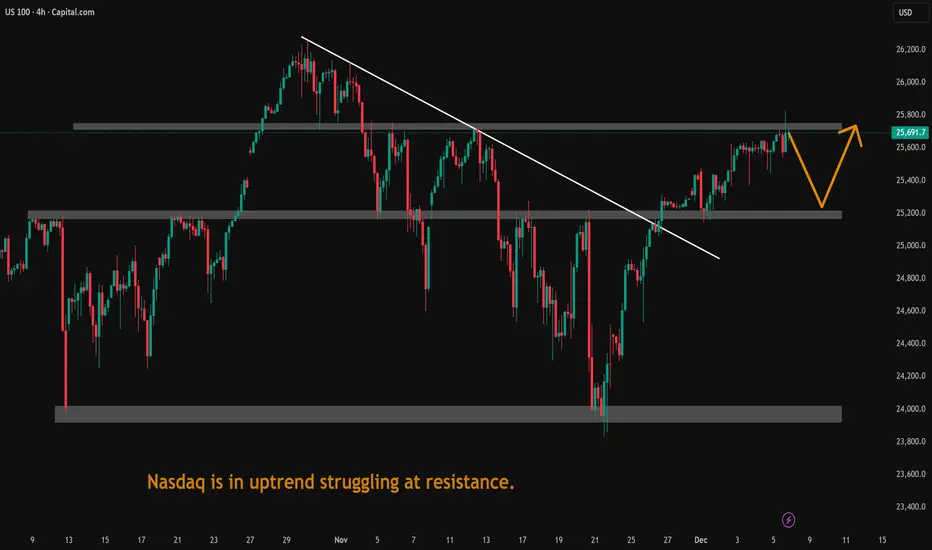
Nasdaq is in uptrend struggling at resistance.Nasdaq is in uptrend struggling at resistance. It may retace next week.
NAS100How to become successful in forex and stock trading: 1.Master fundamentals and technical analysis. 2,Build and follow a solid trading plan. 3.Apply strict risk management (1–2% rule). 4.Stay disciplined—control fear and greed. 5.Record and analyze every trade. 6.Focus on high-quality setups only. 7.Diversify across assets and markets. 8.Keep evolving—study, adapt, and grow daily.
NASDAQDO YOU KNOW WHATS BEHIND THIS OR OTHER IDEAS?? in bio..
Preferably suitable for scalping and accurate as long as you watch carefully the price action with the drawn areas.
With your likes and comments, you give me enough energy to provide the best analysis on an ongoing basis.
And if you needed any analysis that was not on the page, you can ask me with a comment or a personal message.
Enjoy Trading ;)

USNAS100 | Breakout Setup Ahead of PowellOANDA:NAS100USD – Outlook
Wall Street futures slipped on Monday as investors turned cautious ahead of key U.S. economic data and remarks from Federal Reserve Chair Jerome Powell later in the day.
Market participants will closely analyze Powell’s comments for any hints regarding the Fed’s stance on potential rate cuts at this month’s policy meeting.
Technical Analysis
NASDAQ is trading inside a consolidation range between 25200 and 25290, showing a slightly bullish bias while holding above 25200.
A 1H close above 25290 will confirm bullish continuation toward 25430, and a breakout above 25560 opens the path for an extended rally toward 25980.
On the downside, a 1H close below 25200 will expose 25100, and a break below this level will trigger stronger bearish momentum toward 24810 → 24570.
Pivot Line: 25200
Support: 25100 · 24820 · 24570
Resistance: 25300 · 25420 · 25560