Trade ideas

NAS long idea for market open 25/11/2025Currently in a range between H1 polarity/M1 polarity at the top, mirrored to H1/M1 polarity at the bottom.
H4 range trend just below polarity, price comes down to M1 polarity, taps the H4 range trend, absorbs previous H4 low, back up to fail the top of the range and onto the H4 range trend above

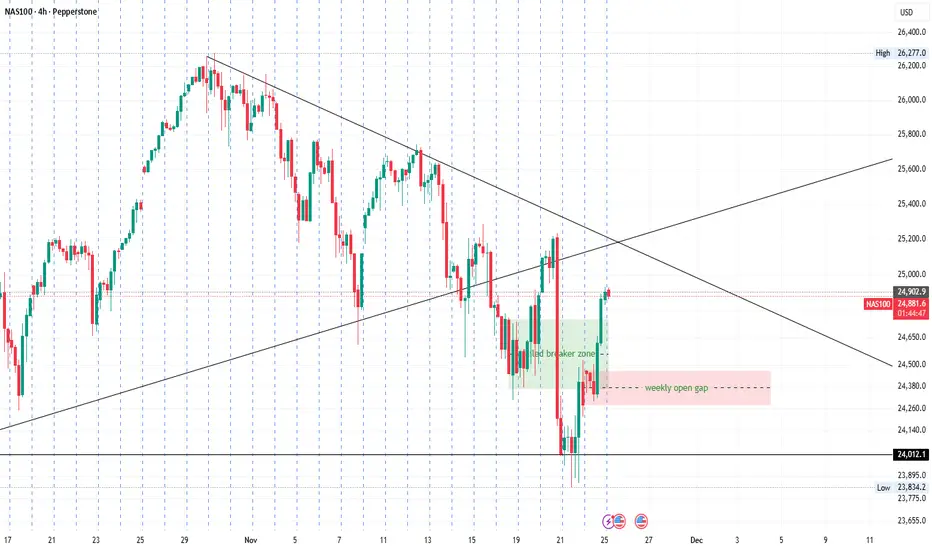
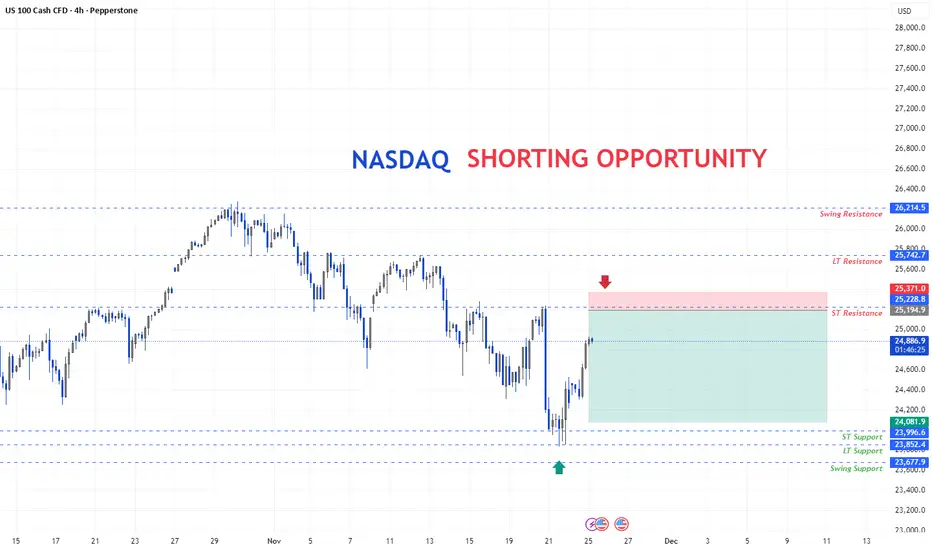
Nasdaq 100 under pressureAfter the Nasdaq 100 fell by more than 3% in the week ending Friday 21 November, the index may extend those losses in the coming days. Recently, the Nasdaq 100 has been trading in a downtrend. Momentum has weakened, as indicated by the relative strength index (RSI), which formed a bearish divergence from mid-September when it began making a series of lower highs while the Nasdaq 100 itself made higher highs. Currently, the RSI is around 43, indicating that the Nasdaq 100 is not yet oversold and may have further downside potential.
However, after trading along its lower Bollinger Band last week, the Nasdaq 100 yesterday recovered some of its recent losses and rose above that lower band. The index broke above resistance at 24,500 early on Monday and went on to pierce the 10-day exponential moving average near 24,700 as it climbed to 24,870 by Monday’s close. Whether this proves to be a temporary rebound remains to be seen, but for now the next significant resistance level is around the trendline near 25,000, followed by the 20-day moving average near 25,250.
Despite yesterday’s bounce, there has been considerable technical damage to the Nasdaq that needs to be repaired if the index is to make further gains. In the near term, the prevailing trend is likely to remain bearish. A break below 24,000 could set the stage for a decline towards 22,700.
Written by Michael J. Kramer, founder of Mott Capital Management.
Disclaimer: CMC Markets is an execution-only service provider. The material (whether or not it states any opinions) is for general information purposes only and does not take into account your personal circumstances or objectives. Nothing in this material is (or should be considered to be) financial, investment or other advice on which reliance should be placed.
No opinion given in the material constitutes a recommendation by CMC Markets or the author that any particular investment, security, transaction, or investment strategy is suitable for any specific person. The material has not been prepared in accordance with legal requirements designed to promote the independence of investment research. Although we are not specifically prevented from dealing before providing this material, we do not seek to take advantage of the material prior to its dissemination.

NAS100 Trade Set Up Nov 25 2025Price remains bullish making HH/HL on the 1h so i will be looking to take buys above PDH to target higher BSL levels but first i will wait for more internal structure on the 5m

NAS100 (Buy)All trades and analyses presented here are based on the **Smart Money Concept (SMC)**.
These analyses reflect only my personal perspective on market structure and price behavior, with charts clearly illustrating the details. The main purpose of sharing this content is strictly for **educational purposes** and to exchange personal experiences in trading.
⚠️ **Disclaimer:**
This content does not constitute financial advice, investment signals, or any guarantee of profitability. Financial markets inherently involve risk, and losses are possible. Each individual is fully responsible for their own trading decisions and outcomes. It is strongly recommended to consult with licensed financial advisors before making any investment decisions.

Nas 100 buy . Full Target already been done Nas 100 buy . Full Target already been done , I publish it in 1 minutes time frime, but not published 🤔

NAS100 at Crossroads: Bulls Eye 25K Breakout or Pullback Trap?Spot Price: 24,875 | Session: London-NY Overlap | 09:43 UTC+4
━━━━━━━━━━━━━━━━━━━━━━━━━━━━━━
🔎 Market Structure Overview
Price action on NAS100 reveals a consolidation phase following last week's bullish momentum. The index is currently hovering near a critical demand zone, with buyers defending the 24,800 handle aggressively. On the higher timeframes, the trend remains intact, but shorter intervals suggest a potential retracement before continuation.
📈 Multi-Timeframe Breakdown
5M & 15M: Minor bearish divergence forming on RSI as price prints higher highs while momentum weakens. Watch for a pullback toward 24,820 for scalp entries.
30M: Price respecting the ascending trendline from Friday's lows. A breach below 24,790 invalidates this structure.
1H: Ichimoku Cloud providing solid support – Tenkan crossing above Kijun signals short-term bullish bias.
4H: Bollinger Bands tightening, hinting at an imminent volatility expansion. VWAP anchored at 24,850 acting as intraday pivot.
🧠 Technical Confluence Zones
Key Resistance: 24,950 – 25,020 (psychological barrier + prior swing high)
Key Support: 24,780 – 24,720 (demand cluster + 50 SMA on 1H)
⚡ Pattern Recognition
A potential ascending triangle is developing on the 30M chart, with horizontal resistance near 24,920 and rising lows. A decisive breakout above this ceiling could trigger acceleration toward 25,050. Conversely, failure at resistance may initiate a corrective wave toward the 24,700 region.
📐 Wyckoff & Elliott Perspective
Current price action resembles Phase C of accumulation under Wyckoff methodology – a spring or shakeout below 24,800 would confirm smart money absorption before markup. From an Elliott standpoint, we appear to be completing wave (iv) of a larger impulse sequence, with wave (v) extension targeting 25,100+.
━━━━━━━━━━━━━━━━━━━━━━━━━━━━━━
🎯 Trade Setup – Intraday Long
Entry Zone: 24,820 – 24,850 (on pullback to demand)
Stop Loss: 24,740 (below structure invalidation)
Take Profit 1: 24,950 (initial resistance)
Take Profit 2: 25,020 (extended target)
Risk-Reward: Approximately 1:2.5
🎯 Alternative Setup – Short Scalp (Counter-Trend)
Entry: 24,940 – 24,960 (rejection at resistance)
Stop Loss: 25,010
Take Profit: 24,850
━━━━━━━━━━━━━━━━━━━━━━━━━━━━━━
⚠️ Risk Note: Monitor US economic calendar for potential catalysts. Thin pre-holiday liquidity could amplify volatility – adjust position sizing accordingly.
Trade wisely. Protect capital first. 💼

A down triangle is forming, tipical consolidation.A down triangle is forming, typical consolidation style, wait for it to break.
Nasdaq wait for the level for the short entry after market structure broken at the nasdaq, it give a sharp pullback, wait for the entry on the short side at the ST resistance.
NAS100 Future | The Bullish Liquidity RuTrading isn't about chasing green candles; it's about anticipating where the "smart money" needs to go to fill their orders. On this NAS100 1H chart, we are stalking a potential Bullish Model #1 setup by waiting for price to revisit the discount zone.
Here is the CRT (Candle Range Theory) breakdown of the projected path:
1. The Trap: Turtle Soup at CRTL 🐢
The chart projects a drop below the CRTL (Candle Range Theory Low) at 24,664. This is the classic "Turtle Soup" mechanic.
The Logic: As the book states, "Turtle Soup is when the market tricks traders by briefly breaking through a level, then reversing".
The Goal: Smart money needs to "run stops... below old lows" to accumulate a long position. We want to see price stab this low to trap late sellers.
2. The Confluence: Fair Value Gap (FVG) 🧲
Notice that the sweep of the lows aligns perfectly with a Bullish FVG (the grey box).
Why it matters: "When Model #1 appears with an FVG... it becomes even more powerful". This gap acts as a magnet to pull price down before the real expansion begins.
3. The Objective: CRTH 🎯
If the trap is set and price reclaims the level (confirming the reversal), the draw on liquidity becomes the CRTH (Candle Range Theory High) at 25,307.
The Cycle: Market moves from range to manipulation (Turtle Soup) to trend. The target is simply the opposing side of the range.
🧠 Trader's Mindset: "Patience is your greatest trading asset". Right now, the chart suggests we are in the waiting phase. Do not try to catch the falling knife. Wait for the sweep of the CRTL, look for the strong reaction (Model #1 confirmation), and then execute.
Disclaimer: This analysis is based on Candle Range Theory concepts for educational purposes. Past performance is not indicative of future results.
Next Step: Set an alert at 24,720. Are you watching for the sweep or buying the dip early? Let me know your plan below! 👇

$NDX - Grab my strong handSame thing as SP:SPX
Buyers looking to close >24,700
Sellers looking to contain below <24,700
OUTLOOK = Mixed, buy dips // sell rips
**** Weekly view below

NASDAQ Analysis – Accumulating at Resistance With Bullish CorrelThe Nasdaq is currently accumulating right beneath a key resistance zone, showing strength despite last week’s volatility. A positive factor heading into today’s session is Bitcoin’s strong weekend recovery — a move that often correlates with green momentum in equity markets, especially tech.
If the Nasdaq manages to break this resistance with conviction, price could push toward the 25,000 trendline during the week, as we are still roughly 2.5% below that level.
The ideal scenario would be:
A strong breakout,
A clean retest of the broken resistance acting as new support, and
A controlled long-position continuation toward 25,000.
As long as accumulation holds and risk sentiment stays positive, the bias remains bullish — waiting for confirmation and a structured entry.

Next NAS100 TPVolume remains steady, which confirms the reliability of the ongoing trend.
These combined technical factors typically precede price appreciation in the Nasdaq 100 , suggesting the index will likely continue to declineshortly based on trend-following and momentum-based trading strategies with limited immediate overbought risk.

NAS100 Trade Secured 1500 PipsPrice swept SSL in London session and continued to make HL internally so i expected price to continue higher

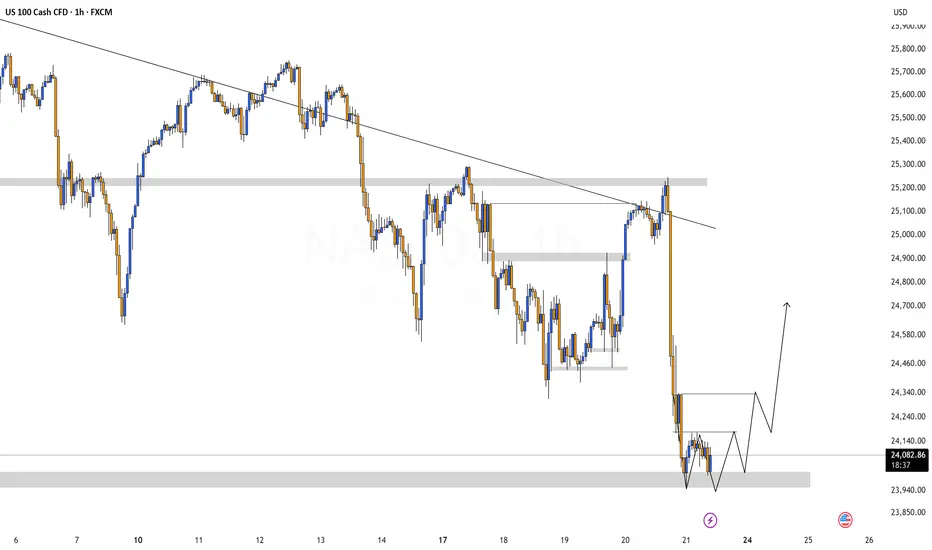
NASDAQ Analysis – Recovery Expected After an Overextended DropYesterday’s sharp Nasdaq drop was surprising, especially considering Nvidia’s exceptional earnings, renewed confidence that we’re not in a bubble, and the strong labor data from NFP. Under normal conditions, the market would likely have reacted with a 2%+ rally.
However, investors are now pricing in the idea that the Fed will not cut rates in December, which created fear-driven selling and an exaggerated move to the downside.
Today, I would like to see a relief recovery, as the index has started to form a double-bottom pattern, a typical structure before liquidity grabs to the upside. If confirmed, price could push back up to take out recent highs.
Historically, after large impulsive drops, the stock market tends to open in green, as investors take advantage of discounted prices. If momentum shifts, the Nasdaq could quickly reclaim lost ground.
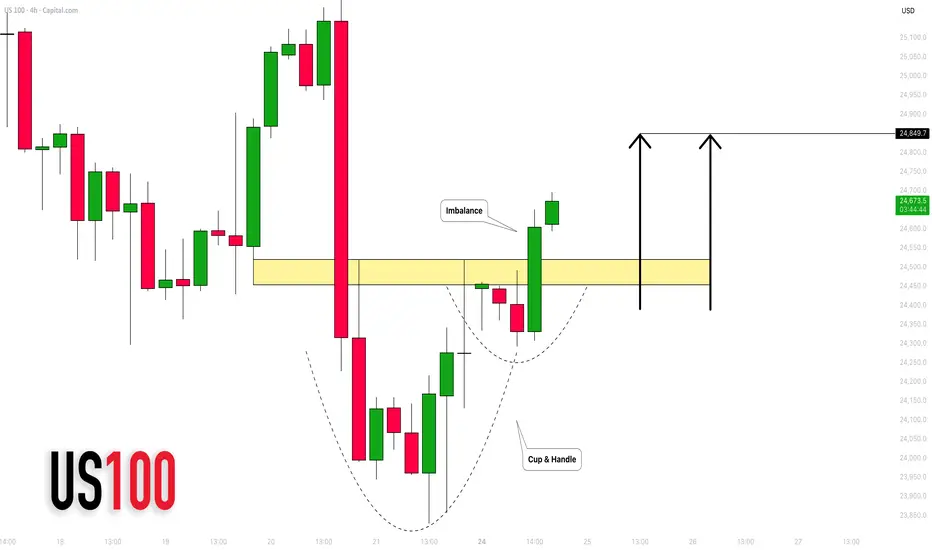
NASDAQ INDEX (US100): Strong Bullish Pattern
There is a high chance that US100 will rise
after a formation of a cup & handle pattern on a 4h time frame
with a breakout of its neckline with a bullish imbalance.
Expect a rise at least to 24850
❤️Please, support my work with like, thank you!❤️
I am part of Trade Nation's Influencer program and receive a monthly fee for using their TradingView charts in my analysis.
Nas100 RetraceThese combined technical factors typically precede price appreciation in the Nasdaq 100 , suggesting the index will likely continue to rise shortly based on trend-following and momentum-based trading strategies with limited immediate overbought risk

NASDAQDO YOU KNOW WHATS BEHIND THIS OR OTHER IDEAS?? in bio..
Preferably suitable for scalping and accurate as long as you watch carefully the price action with the drawn areas.
With your likes and comments, you give me enough energy to provide the best analysis on an ongoing basis.
And if you needed any analysis that was not on the page, you can ask me with a comment or a personal message.
Enjoy Trading ;)

NAS100 Trade Set Up Nov 24 2025Price is making bullish structure on the 1h so i want to see an internal sweep of SSL followed by 1m-5m IFVG/CISD to target PDH and higher BSL

NAS100 – Strong Order Block Explained | High-Volume Breakout & CA Strong Bearish Order Block formed on NAS100 after a powerful bearish Marubozu breakout candle, showing clear displacement and confirming aggressive institutional selling pressure.
1. Large Breakout Candle (Marubozu)
A strong bearish candle broke through previous structure with real displacement.
This is the first sign of a valid Order Block — a move driven by actual institutional flow, not just a liquidity sweep.
2. Clean Imbalance (IMB) Created
Right after the breakout, price left behind a clean Imbalance.
This IMB highlights urgency and confirms that big players were actively pushing the market.
3. Price Returned to the Strong Order Block
After the breakout, price slowly retraced back to the origin of the move — the Strong Order Block.
Once price tapped the OB, it reacted sharply and immediately moved lower, showing that institutional sellers were defending this level.
4. Volume Confirmation
Volume during the breakout was significantly higher than average.
This reinforces that the move was driven by institutional order flow, not retail traders.
🔑 Key Takeaways
This setup is a textbook Strong Bearish Order Block, meeting all core criteria:
Clear displacement
Clean Imbalance formation
Strong volume confirmation
Price returning to the OB and reacting decisively
A high-probability bearish setup built on structure, volume, and institutional footprints.

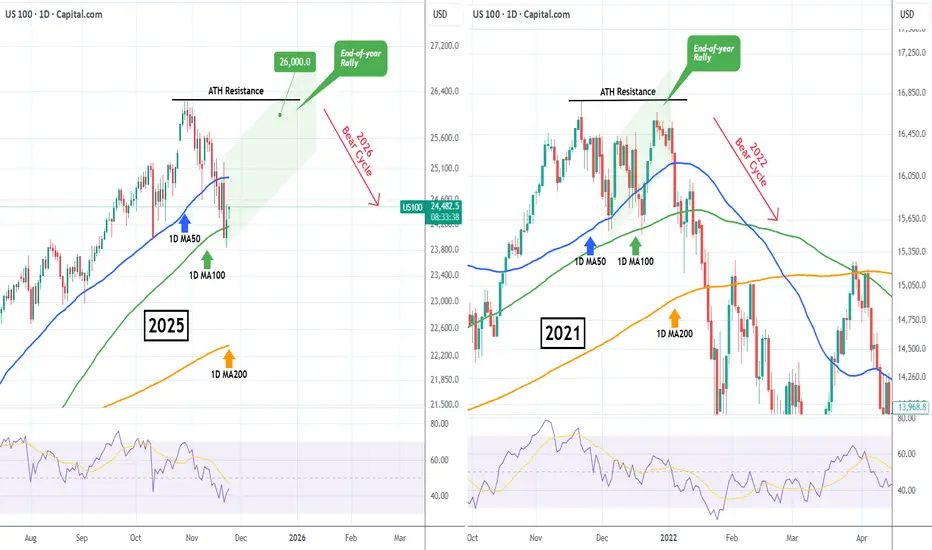
NASDAQ Santa Rally back to 26000 started?Nasdaq (NDX) rebounded on Friday after marginally breaching below its 1D MA100 (green trend-line) for the first time since May 09! The continuation today is a sign of a potentially strong rebound, the traditional end-of-year rally that is know as 'Santa's rally'.
Based on the 2021 Bull Cycle, which after touching its own 1D MA100 it started a final rally that almost tested its ATH Resistance, we can expect Nasdaq to now rise towards the end of the year to potentially 26000.
Could this be the last rally before a new Bear Cycle in 2026?
---
** Please LIKE 👍, FOLLOW ✅, SHARE 🙌 and COMMENT ✍ if you enjoy this idea! Also share your ideas and charts in the comments section below! This is best way to keep it relevant, support us, keep the content here free and allow the idea to reach as many people as possible. **
---
💸💸💸💸💸💸
👇 👇 👇 👇 👇 👇
Next Nas100 GainThese combined technical factors typically precede price appreciation in the Nasdaq 100 , suggesting the index will likely continue to rise shortly based on trend-following and momentum-based trading strategies with limited immediate overbought risk

USNAS100: Key Breakdown Levels Ahead — 24150 Next?USNAS100 | Technical Overview
The Nasdaq index continues to show weakness below 24460, keeping bearish pressure dominant in the short and medium term.
Technical Outlook
As long as the price remains below the pivot line at 24460, the bearish momentum is expected to continue toward 24150.
A break below 24150 opens the door for a deeper move toward 23930.
If the market closes a 4H candle below 23930, this will confirm a stronger bearish trend targeting 23700.
On the other hand, bullish momentum will only be activated if the price closes a 1H or 4H candle above 24760, which would signal a reversal toward higher levels.
Key Levels
Pivot Line: 24460
Support: 24150 · 23930 · 23700
Resistance: 24580 · 24760 · 25200
