ETH.D comprehensive analysis Hi everyone
Today I am gonna have good view on ETH by cycling analysis and the upcoming prediction.
As you can see it had a 1x projection then also did its correction; all in one cycle
Next cycle it had a twice projection but also in a wider timeline.
So it may seem getting stronger but comparing the projection by time period shows that no more momentum but also not weaker one!
So till the 15% it clearly have a strong trend.
But from that area it started a correction. This one was longer in timeline but comparing to previous correction shows weaker momentum!
Although you and others may be afraid but it is showing a hidden strength!
That completely needs a thorough knowledge.
So what is hoing on?!
Just buy and accumulate ETH from here.
We are targeting higher areas from 15% to 20%
Trade ideas

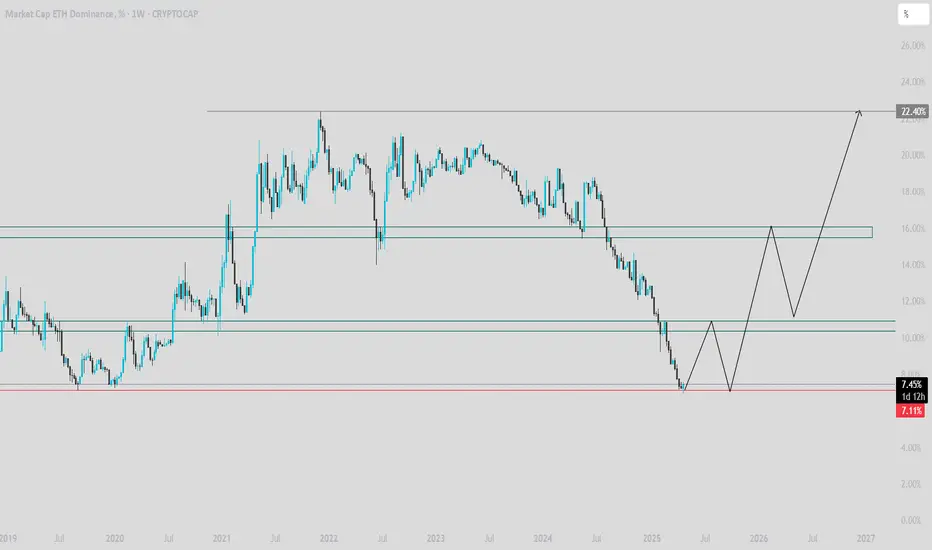
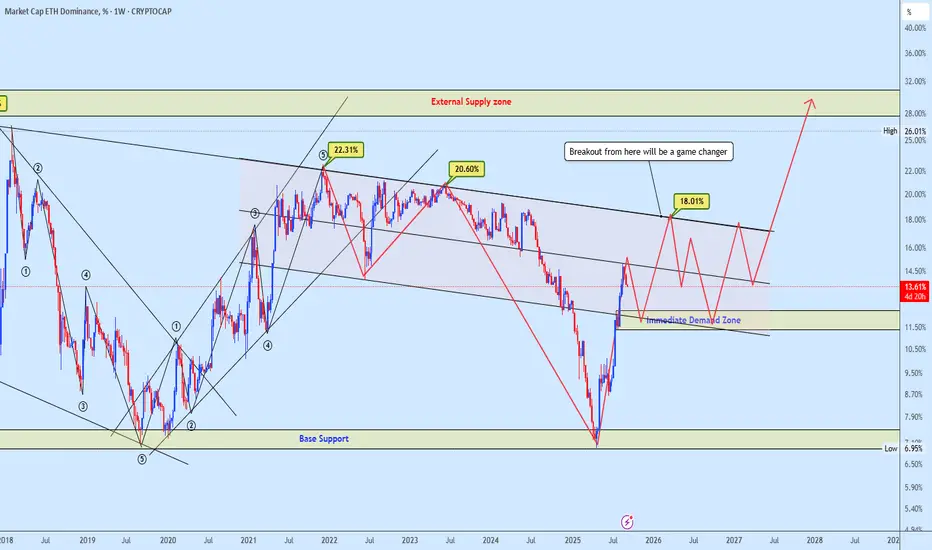
ETH Dominance Game Changing Levels AheadETH dominance has been climbing strongly from the base support and is now approaching the immediate demand zone that should act as a key structure for the next big move.
A breakout above the channel resistance around 18%–20% will be a real game changer, opening the path towards the external supply zone at 26%–28%. This will mark a major shift in capital flow back into Ethereum and could drive a strong bullish narrative across the ETH ecosystem.
As long as the immediate demand zone continues to hold, the bias remains bullish with higher lows and breakout potential on the horizon. Failure of this zone, however, may re-expose the lower structure towards the base support.
What’s your view on ETH dominance — do you see Ethereum reclaiming a larger share of the market?
Its Time For Altcoins 📈 ETH Dominance has clearly completed a 4-wave cycle, and we are now at the beginning of wave 5, with the main target for this wave being 16.4%
👉 An important point regarding this chart is that its bullish movement indicates capital flowing into Ethereum, which in turn leads to increased buying pressure across the overall altcoin market. Therefore, I personally expect a bullish rally in altcoins

ETH.D (Ethereum Dominance) Weekly TF 2025
Summary:
Ethereum Dominance (ETH.D) has likely bottomed after retracing to its 78.6% Fibonacci level (~6.59%) and is showing early signs of a structural reversal. With institutional inflows, growing staking adoption, and key upcoming Ethereum upgrades, ETH.D may reclaim significant market dominance over the next 12–18 months. Our chart anticipates a bounce-pullback-rebound structure, aiming for 3 target zones: TP1 (23.5%), TP2 (30.8%), and TP3 (39%).
Contextual Market Alignment:
This ETH.D bullish bias aligns strongly with our broader market outlook:
TOTAL Market Cap Analysis → Bullish breakout structure, indicating overall crypto expansion.
TOTAL2 (Altcoin Market Cap Ex-BTC) → Bullish retracement completion and extension targets active.
BTC.D (Bitcoin Dominance) → Bearish confluence zone, suggesting Bitcoin may underperform versus ETH and altcoins, freeing up dominance space for ETH.D to rise.
Chart Context:
This weekly ETH.D chart uses a Fibonacci retracement from the top (~30.81%) to bottom (0%) to identify potential reversal zones. The dominance hit a key support area at the 78.6% Fib retracement (6.59%), showing a reaction that may develop into a reversal. The roadmap includes:
Rebound toward TP1 (23.54% = 23.5%)
Minor correction or consolidation
Breakout continuation toward TP2 (0.0% = 30.8%)
Extension leg targeting TP3 (–27% = 39%)
Key Technical Observations:
Support Levels:
78.60% = 6.59% (bottom support)
88.60%=3.5%
Possible Resistances:
61.80% = 11.77%
48.60% = 15.84%
38.20% = 19.04%
Resistance & TPs:
TP1: 23.54% (23.6% Fib)
TP2: 30.81% (Full retrace = 0%)
TP3: 39.13% (–27% extension)
Current level: ~9.36%
Clear bullish structure with a “bounce–pullback–rebound” sequence
Indicators:
Fibonacci retracements from ~30.81% to 0%
Structural pattern: rounded bottom / double bottom
Hidden bullish divergence forming on weekly timeframe
Fundamental Context:
Institutional Inflows & ETF Dynamics:
Since July 2024’s launch of spot Ether ETFs, inflows have been strong with a 15-day streak totaling approximately $837 million (~25% of total net inflows).
Recently, the SEC approved options trading on spot ETH ETFs (e.g., BlackRock, Grayscale), deepening liquidity and offering hedging mechanisms.
BlackRock is now pushing to add staking functionality allowing yield generation within an ETF wrapper. If approved, this could markedly increase demand.
Staking Growth & On-Chain Supply Dynamics:
27% of ETH is already staked, and ETF inflows could lift that by >10%.
A staking ETF would institutionalize ETH staking: more capital locked, less circulating supply → supply constraints could support dominance and valuation.
Ethereum Backbone in DeFi & RWA:
Ethereum still leads the Real-World Asset (RWA) space: over 50% market share and ~$5–6 billion in assets tokenized on-chain.
Its core infrastructure underlies the majority of DeFi, smart contracts, and stablecoins, reinforcing ETH.D’s structural resilience.
Network Upgrades & Tech Progress:
The Pectra upgrade (mid-2025) is on the horizon, introducing EIP-7251/7702, improving validator flexibility and network usability.
Combined with recent Dencun improvements, Ethereum is becoming cheaper and more efficient, boosting adoption in L2 ecosystems.
Price action & on-chain indicators:
ETH price has surged ~46% in the past 30 days, driven by ETF demand; some analyst forecasts target $3,000–5,000 year-end.
The withdrawal of ~$1.2 billion ETH from exchanges suggests increasing long-term holdings and less selling pressure.
Integrating with Your Technical Setup:
Level: 78.6%–61.8% bounce zones (6–11%)
Fundamental Support: Institutional re-entry via ETFs often begins with accumulation near support.
Level: TP1 at 23.6% (23.5%)
Fundamental Support: Could coincide with ETF inflows + early vesting of staking narratives.
Level: TP2 (~30.8%)
Fundamental Support: Full retrace driven by mass ETF adoption, options trading, and upgrade momentum.
Level: TP3 >39% (–27% ext.)
Fundamental Support: If staking ETF and yield-bearing structures go live, ETH.D could reach new dominance highs.
Summary of Fundamental Catalysts:
Spot ETH ETF inflows (~$800 M), with options exposure adding liquidity.
Upcoming staking ETF (BlackRock, Grayscale) with >10% locked-up supply implications.
Ethereum remains the DeFi and RWA backbone, sustaining structural demand.
Protocol upgrades (Pectra, Dencun) enhance scalability and adoption.
On-chain withdrawal trends show growing holder conviction.
Narrative / Bias & Strategy Implication:
ETH.D has likely completed its correction and is primed for a staged bullish reversal, mirroring prior cycles. The chart forecasts a rally toward TP1, where some short-term profit-taking and rotation to alts may occur (Alts season). Following that, a retrace may set up the next impulsive move to reclaim lost dominance and eventually challenge prior highs.
Time Horizon: Mid-2025 to late 2026

Eth dominance Eth going back to 4800 very soon dominance is about to break to the upside Macd divergence and looks bullish to me we will see eth pump again

$ETHBTC rolling over. $ETH.D in uptrend. $SOL.D looks bullishWhat is happening in the Altcoin universe ? Is Altcoin season in? CRYPTOCAP:ETH and CRYPTOCAP:SOL are the best indicators of the overall sentiment in the Crypto market. Altcoin season usually starts when BINANCE:ETHBTC and CRYPTOCAP:ETH.D both bottoms out. That happened in April. Since then, BINANCE:ETHBTC and CRYPTOCAP:ETH.D have been in an uptrend. Our cycle target for CRYPTOCAP:ETH.D remains 17%.
CRYPTOCAP:BTC.D : Cycle tops are in. CRYPTOCAP:ETH.D : Bounce form the all-time lows for CRYPTOCAP:BTC.D by RabishankarBiswal — TradingView
But there is another phenomenon which can indicate the rotation to lower cap Crypto. The BINANCE:ETHBTC is rolling over in the last couple of weeks and CRYPTOCAP:SOL.D is attempting a breakout. CRYPTOCAP:SOL.D did reach the cycle peak of 3.9% and since then it has rolled over and currently 2.92%. If CRYPTOCAP:SOL must prove its serious Mega cap in the Altcoin space, then it must at least reclaim the previous highs.
Verdict: Altcoin season is on. CRYPTOCAP:ETH and CRYPTOCAP:SOL looks promising now. CRYPTOCAP:ETH.D should reclaim 17% and CRYPTOCAP:SOL.D should reach 4%.

Alt season time (PART 1)Hello friends
Well, the question that has come up a lot for you these days is the alt season or its beginning.
Well, you see the Ethereum dominance chart that the candle closed well on the weekly time frame, but on the daily time frame, if the price holds the 14.20 area and the 14.85 resistance is broken well and validly, we will go for the higher numbers that we have specified, and in this case we will see good growth of altcoins.
If the price falls and the support at 14.20 is broken, we will see a drop in the price of Ethereum as well as altcoins, so these next few days are very important.
*Trade safely with us*

ETH Taking Over the Market – 20% Dominance in SightEthereum dominance is surging towards its all-time high of 20%! 🚀
I remain bullish on CRYPTOCAP:ETH and expect it to break $5,000 in the coming weeks — unless Bitcoin
decides to make a deep pullback. ⚡️
⏳ Not yet the time to buy! Follow me and I’ll tell you the exact entry for Ethereum. Don’t miss it.

Altseason Checklist! To spot the beginning of an Altseason, there are several key charts you need to track on TradingView. These indicators show whether capital is really leaving Bitcoin and flowing into altcoins.
1. Altseason Starts with ETH
Almost every time, the first signs come from Ethereum (ETH). When ETH gains strength, the rest of the altcoins usually follow.
2. BTC Dominance (BTC.D) ⬇️
Condition: forming Lower Low / Lower High
Interpretation: money is rotating out of BTC and looking for better opportunities in altcoins.
3. ETH Dominance (ETH.D) ⬆️
ETH’s share of the market is increasing.
This shows Ethereum is taking leadership over the flow of capital.
4. ETH/BTC Pair (ETHBTC) ⬆️
Key: breakout to the upside with weekly confirmation
This ratio reveals whether ETH is truly outperforming BTC.
When ETHBTC breaks up ⇒ strong trigger for ETH leadership.
5. TOTAL2ES ⬆️
Represents market cap of all altcoins excluding BTC.
Growth here means real money is flowing into alts, not just cycling into stables.
6. TOTAL3ES ⬆️ (with delay)
Represents market cap of all altcoins excluding BTC and ETH.
When this chart starts rising ⇒ after ETH, the rest of the alts join in.
This is usually the final confirmation of Altseason.
7. USDT Dominance (USDT.D) ⬇️ or ↔️
Should move down or at least stay flat.
If it rises too much ⇒ capital is not entering alts, it’s parking in stablecoins ⇒ Altseason trap.
⚠️ Key Note – Watch Out for the Trap
The biggest trap is when BTC.D is dropping and ETH.D is rising, but USDT.D is also climbing.
That doesn’t mean Altseason – it means money is leaving BTC but hiding in stablecoins instead of flowing into alts.
📌 Summary:
Starts with ETH
Confirm with BTC.D ⬇️, ETH.D ⬆️, ETHBTC ⬆️
Money entering alts ⇒ TOTAL2ES ⬆️
Expansion to full alt market ⇒ TOTAL3ES ⬆️
Watch USDT.D to avoid the trap.
ETH.D : 5-Wave Bull Run Over –Bitcoin to Outshine EthereumeEthereum Dominance (ETH.D) has completed a textbook 5-wave impulsive rally on the weekly timeframe, signaling the end of its upward cycle and entry into a deep corrective phase. As of August , ETH.D at 13.37% is rejecting the key order block at ~14%, hinting at weakening momentum. This shift favors Bitcoin's outperformance, as capital rotates from ETH to BTC, potentially boosting BTC/ETH ratio and Bitcoin returns during the downturn.
NeoWave Wave Count (Daily Chart):
The rally from ~10.5% lows unfolded in 5 waves: Wave 1 to ~11.41%, Wave 2 correction to ~10.11%, Wave 3 extended to ~13.97% (161.8% of Wave 1), Wave 4 shallow to ~13.32%, and Wave 5 topping at 13.97% with the 1.618 Fib extension (1.141%).
Monowave count (~55-70 subwaves) validates the impulse, with alternation (Wave 2 deep/time-extended, Wave 4 shallow/short). The ascending channel (yellow) has been touched multiple times, and the recent rejection confirms exhaustion.
Weekly Chart Insight:
On the weekly TF, ETH.D has hit a major order block at ~14% (1.425%), not the channel top, coinciding with the 1.618 Fib extension from 2023 lows and historical resistance from 2018 highs (~52%). This multi-year descending channel holds firm, with price failing to break the OB—suggesting reversal to midline ~12.5% or lower (38.2%-50% Fib retrace of rally).
Why Bitcoin Outperforms From Here:
As ETH.D corrects (likely a Zigzag or Flat, targeting 11%-12%), Bitcoin gains dominance, driving better returns for BTC holders. Expect BTC/ETH ratio to climb (current ~12.5, target 14-15), with Bitcoin yielding 10-20% superior performance in risk-off environments. If ETH.D drops below 12.5%, correction accelerates to 10% (78.6% Fib), amplifying BTC's edge.
Trade Idea (Bearish ETH.D / Bullish BTC):
Entry: Short ETH.D (or long BTC/ETH pair) below 13.32% on BOS confirmation in weekly.
Targets: TP1 at 12.5% (channel midline), TP2 at 11% (50% Fib).
Stop Loss: Above 14.25% (OB high, R:R ~1:3).
Sizing: 1-2% capital; trail stops on midline breaks. Watch dominance flips—crypto rotations can spark quick BTC pumps.
ETH bulls, pivot to BTC now! #ETHDominance #NeoWave #BitcoinOutperformance #CryptoAnalysis

This Ethereum SeasonThis Ethereum Season
Ethereum Dominance / Bitcoin Dominance
CRYPTOCAP:ETH.D / CRYPTOCAP:BTC.D

Balding Ape Sports Car Club AltSZN Indicatorthis is when alts rip using the Moonboys Money Line we can see 96% alts go weeeee

Ethereum’s Rise in Market Dominance – The Queen’s Mov👑♟ Ethereum’s Rise in Market Dominance – The Queen’s Move 📈🔥
Most of the time, traders focus on Bitcoin dominance as the leading gauge of crypto market capital flow. But right now, it’s Ethereum’s turn to shine — the Queen of crypto is starting to dominate the board.
Ethereum dominance has surged from the 7.18% lows, reclaiming the 0.618 Fibonacci retracement zone, and is now holding strong near 12.73%. This bounce comes after years inside a large descending channel, where past peaks hit 30.73% in 2018 and 22.58% in 2022.
With the next key target sitting at 18.29%, ETH dominance is flashing early signs of a potential market shift. If the Queen breaks past the upper channel resistance around 20.32%, we could see a historic run toward the 30–37% dominance range.
🔑 Key insights:
Bounce from major long-term channel support
0.618 Fib level reclaimed — bullish technical signal
Room to climb before meeting the upper trendline resistance
Breakout could mark a major power shift in crypto market share
If Bitcoin is the King, Ethereum is proving once again why she’s the Queen — strategic, resilient, and ready to take more of the board.
One Love,
The FXPROFESSOR 💙
Disclosure: I am happy to be part of the Trade Nation's Influencer program and receive a monthly fee for using their TradingView charts in my analysis. Awesome broker, where the trader really comes first! 🌟🤝📈

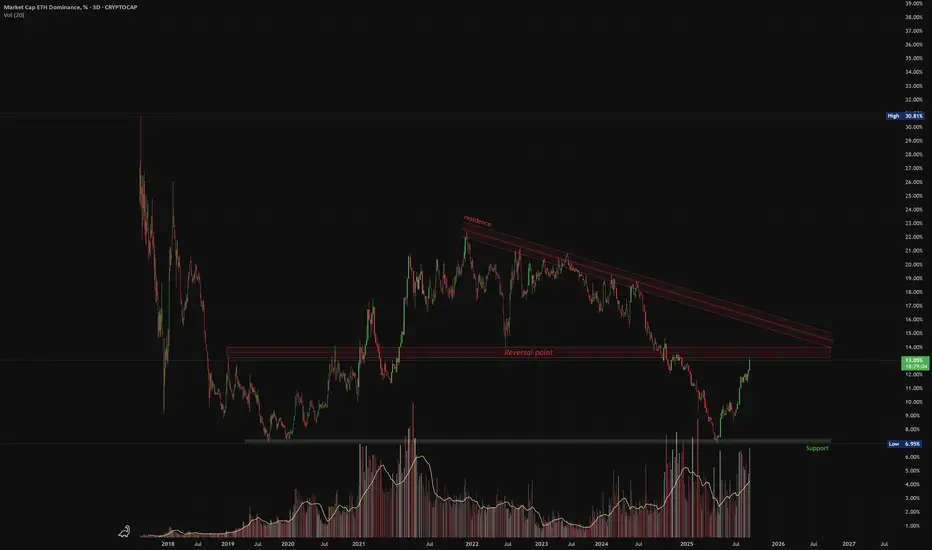
ETH Dominance – Possible Pullback at Key ResistancePair: ETH Market Cap Dominance (%)
Timeframe: 3D
Structure: Descending Trendline + Horizontal Resistance
Volume: Rising on approach to resistance
📉 What’s happening?
ETH dominance has rallied from support and is now approaching a historically strong resistance zone marked by multiple rejection points. Price is also near the long-term descending trendline, which has acted as a ceiling for over a year.
🔻 Caution Zone:
Resistance between 18.5%–19.2%
Historical reversal area (marked as “Reversal Point”)
📌 Pullback Triggers:
Bearish candle formation at resistance
Declining volume on further push up
Failure to close above the descending trendline
Bias: Short-term pullback likely unless ETH dominance breaks and closes above resistance with strong volume.
ETH Dominance Eyes 12.60%ETH.D on the Daily
Next resistance is approaching near the 0.236 Fib level, around 12.60%.
In my view, this level will eventually flip to support — but it may take time. Price could need a retest, or wait for the 50MA (maybe even the 200MA) to assist the breakout.
Either way, we’ll be here to watch it unfold.
Always take profits and manage risk.
Interaction is welcome.

ETH Dominance 1D – Altcoin LeadershipEthereum dominance daily chart. Used to assess ETH leadership and confirm potential altseason trends.

ETH Dominance – Golden Cross, New Era?This is ETH Dominance on the Daily chart.
A golden cross just printed, and the last time we saw this, at similar levels, was February 2020. Back then, dominance climbed steadily, bouncing off the 200MA repeatedly.
Today, price is approaching the 0.236 Fib level, which could act as short-term resistance and send us back to retest the 200MA as support.
But unlike 2020, everything has changed:
– ETH is getting institutional support via ETF flows
– The SEC confirmed ETH is not a security
– The RWA narrative is gaining serious traction
That’s why this golden cross could mean more than just a signal, it may be the start of a much stronger structural uptrend.
My humble guess?
ETH Dominance continues climbing with the 200MA as support.
It won’t be a smooth ride, but the direction might be set.
Always take profits and manage risk.
Interaction is welcome.

Ethereum season is here for a yearWho's leading the crypto market right now?
- Coinbase, Base, and Farcaster
Let me ask you a question. Will base launch its own token? No.
USDC on Base is their main token, and they are happy with it.
What people don't see yet is, base is base.eth.
Also, ETH hit its all time low dominance, and bouncing back up.
Ethereum foundation laid off many people, and going through hard reform.
I think Ethereum market dominance will hit 14% within a year.
That would be about 1ETH = $10,000.
Let's come back in a year.

Has the alt season started?Hello friends.
One of the signs of the start of the alt season is the Ethereum Dominance Index, which if it grows, we expect an alt season.
Now what can be seen in the chart is that Ethereum Dominance has started its growth, which means that the growth of altcoins has increased compared to Bitcoin, so we can give more weight to altcoins in the investment portfolio.
Now we can expect that after a certain amount of growth of this index, a correction will begin to start the upward trend.
Make your last purchases in the correction, don't say you didn't say so. (This will be a memory)
I hope you have used this analysis well.
Follow us on Pim to see more analyses.

ETH is backETH says: Hey you there! I am still alive.
ETH.D bounced off a multi-year top. The altseason is inevitable. Fasten your seat belts ...

Ethereum Dominance Possible Doing Like ThisDoing sweep low under 7% and maybe ETH around 1100 and then accumulation phase before back to the range and testing another resist

Super bullish ETH now. ETH.D, ETHBTC, ETHUSD all bottom signalsMy forecast for ETH Dominance. I believe it will come back with vengeance relative to BTC. CRYPTOCAP:ETH.D BINANCE:ETHBTC BINANCE:ETHUSD COINBASE:ETHUSD BITSTAMP:BTCUSD

Ether dominance projectionThis is another indicator for the altseason that everyone is expecting.
Once this starts lifting to the upside we can say that an altseason is brewing .Until then we can only watch and accumulate alts at these lower prices.