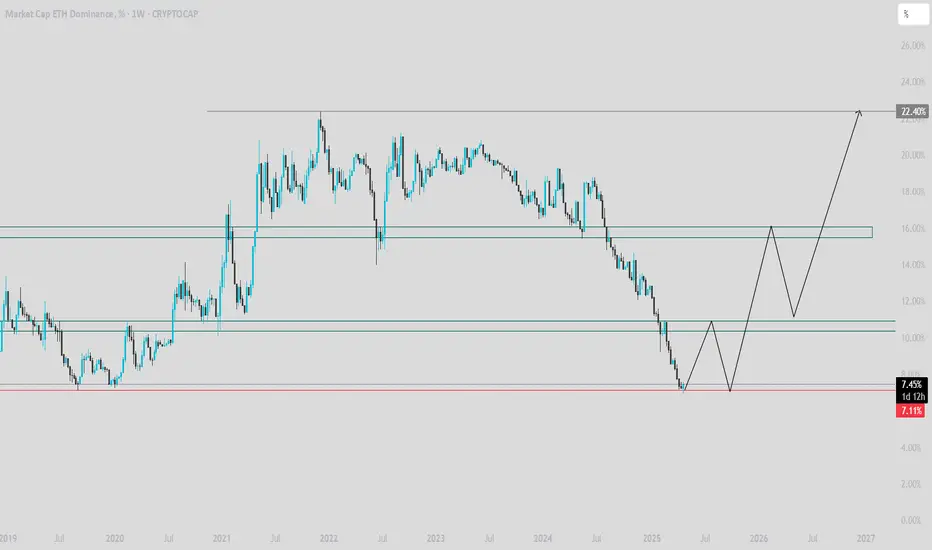
Ether dominance projectionThis is another indicator for the altseason that everyone is expecting.
Once this starts lifting to the upside we can say that an altseason is brewing .Until then we can only watch and accumulate alts at these lower prices.
ETH.D trade ideas
I WARN EVERYONEAltcoin Crash Started March 2024. The Road Down Is Open, Altcoins May Suffer and Fall Another 90%. Expect 2025 to Be Bearish. Harmonic patterns may see ETH dominance fall by 3-4%. Be careful.
My ideas are confirmed -
1.
2.
3.

ETH Dominance#ETH is approaching its All time low dominance of 7.09%.
Eth is declining every day as compared to #btc.
Will history repeat itself by reversing from this zone?
Or
#Ethereum will be doomed!
C
Share your views???

ETH.D potential major bounce incoming!!Expect a reversal on ETH.D here very soon. We have hit major support levels. Sentiment has not been this low for years. BTC and Total Alts also showing strength. Keep an eye on the ETH.D chart.

Ethereum Dominance Possible Doing Like ThisDoing sweep low under 7% and maybe ETH around 1100 and then accumulation phase before back to the range and testing another resist

ETH.D at bottom!This is the buy zone and there would be fluctuations at the bottom.
you can see probable pathway clearly.
THERE WILL BE A PROLONGED ALT SEASON.

ETH.DOMINANCE Bullish divergenceIn ETH.DOMINANCE chart show clear bullish divergence on daily timeframe which means ETHUSD and ALTCOINS in bullish momentum in coming days. Stay focus on bullish side and ready for uptrend.

ETH.DInterest in the Ethereum network continues to decline.
Recently, the network has mainly been used for gambling with meme coins.
I see no meaningful use for humanity.

ETH Dominance Very Dominant Downtrend (RSI)The RSI on ETH.D shows a large channel with a strong bearish favor
Currently RSI is in oversold area
I expect on this Weekly chart RSI to reverse and possible one day even get out of this extremely bearish state
Weekly

Eth.dEthereum dominance is in weekly demand, the market may turn in favor of Ethereum altcoins at any moment, be patient.


The Value of Looking at Volume in Ethereum DominanceIt seems like it's time for a long-term bull run in Ethereum dominance.

Make Etherium Great Again (MEGA)ETH dominance has reached its absolute bottom. So, guys, Etherium is about to start a massive rebound. If not now then never

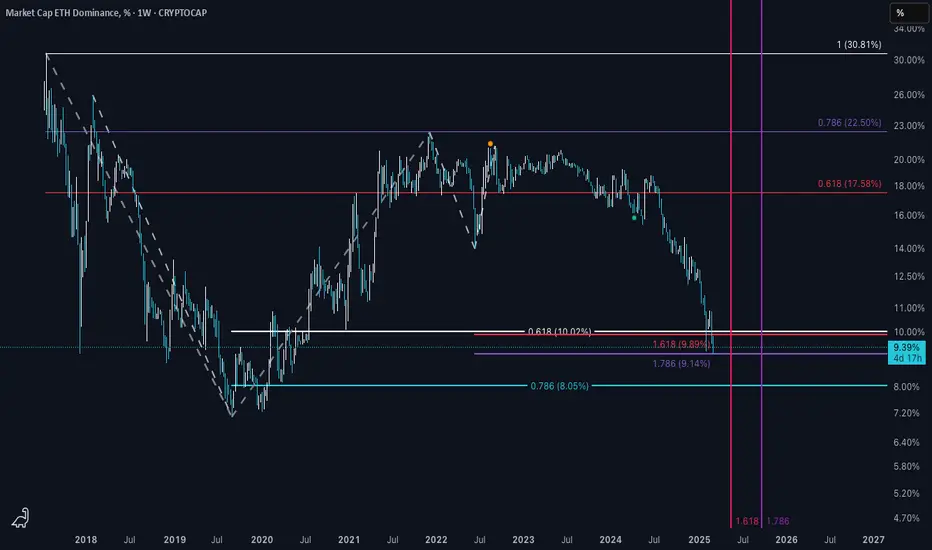
Approaching the Crossroads ETH.D is in the 1:0.618 GW zone.
Currently being held up by the 1.786; If this support structure collapses, there may be a high probability that the 1:0.786 overshoot will be the next stop.
When ETH.D starts taking off and BTC.D starts collapsing, this is the start signal for alt coin season.
The trend based fib time tool suggests this reversal may happen between May and September. This is quite a large time gap so I'm favoring somewhere in the middle. It could also reverse at a sooner time, but patience is key.
Considering the time left in this market cycle, it could be some wicked waves up. But we may be right in the middle of market cycle transformation. Meaning extended/more complex corrections and extended bull run phase. Time will tell if the average 4 year market cycle is something in the past.
- Not Financial Advice -
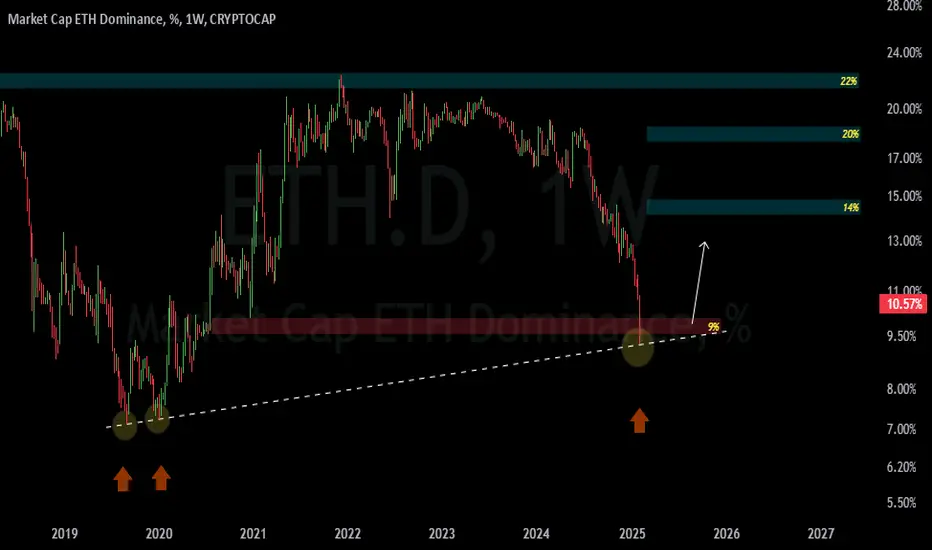
ETH big pump comingas you can see ETH.D hit the bottom so i think we are so close to altseason
Always do your research

Ethereum DominanceYou all know that the market is made of numbers and algorithms and if you believe it then you never let you emotions decide for you.
I am talking just about this yellow box and I do not care for any thing else and it the way Elliott or Technical work for me. I expect a huge rally for Eth. till to May 2027 or Sep. 2028.
Time will talk about this scenario.

ETH Dominance Double Top FormationIf dominance of ETH can't handle 10% we will see dominance around 7% because double top pattern on monthly - weekly timeframe
But if not break we will see some consolidation here and waiting for other news

Will we see a reflection from here !?CRYPTOCAP:ETH.D
I think it has reached enough levels and we may see a reflection from here .
waiting ...
eth dominance poorly drawn but maybe 1 last double bottom?eth btc perhaps double bottom structure, then rally to the downward sloping trend-line for alt season/end of cycle.

Very sensitive pointAfter a long time, we are now in a very attractive area that can make good profits.
The Ethereum Daminenis is now in a area where you can gradually be out of bitcoin's assets and enter the Ethereum and other penis assets.

Ethereum Dominance and the Case for a Massive RallyEthereum’s market dominance chart has a fascinating story to tell – one that echoes the past and gives us reasons to anticipate a bright future.
Historical Context
In 2021, Ethereum found itself in a similar position as it does today. The dominance reached this exact support zone, a level that historically marks the beginning of significant movements. From this area, Ethereum’s price surged by over 250%, initiating one of the most remarkable rallies in its history.
Fast forward to 2025 – Ethereum dominance is now revisiting this same critical support level, a zone between 11.09% and 11.39%. Historically, this area has acted as a springboard, pushing ETH dominance and price into substantial uptrends.
Why This Matters
Historical Patterns: The same setup led to a massive price rally in 2021. While history doesn’t always repeat, it often rhymes.
Market Momentum: Ethereum’s dominance reflects its share of the crypto market. A bounce here could indicate capital rotation into ETH, setting the stage for an ETH-led altcoin rally.
Strong Fundamentals: Ethereum’s continued development and adoption create a solid foundation for future growth, which could amplify any technical bounce.
Key Questions
Will Ethereum dominance bounce from this critical level, as it has before?
Could this signal a broader ETH bull run, mirroring the 2021 rally?
Watch the Chart
Keep a close eye on this Ethereum Dominance chart. Dominance represents the percentage of the total crypto market cap held by Ethereum, and this level has historically been a reliable indicator of major moves.
Conclusion
The stars seem to be aligning for Ethereum. If dominance bounces here, we could see a replay of the explosive growth of 2021. Are you prepared for what might come next?

The "Flippening"The "Flippening" goes back to 2017, a term coined back then referring to a possible future where Ethereum overtakes the marketcap of Bitcoin.
Should that ever occur, it would also take a larger portion of market dominance than Bitcoin
Here's a silly chart, just for fun, imagining that scenario during the current bull market.

Eth Dominance 90% MoveEth Dominance like Eth/Btc has hit a 4 year low in a market with 4 year cycles
A full retracement shows from the 100% fib back to the 23.6% fib - This means we will see a bounce from here back up to the 50% fib at least, approximately a 90% increase for Eth Dominance and consequently Eth/Btc
Erc-20 coins will get pulled along for the ride
