ethereum towards + $10kETH towards + $10K
Ethereum’s Journey to + $10k Successfully Completes Major Milestone with PECTRA Update
ETHEREUM trade ideas

Ethereum - The bottom is finally in!Ethereum - CRYPTO:ETHUSD - is starting the rally:
(click chart above to see the in depth analysis👆🏻)
Finally, after dropping an expected -65% over the past couple of months, Ethereum is retesting and already rejecting a significant horizontal structure. Together with the strong confluence of support, Ethereum is now creating a long term bottom, initiating the next bullish cycle.
Levels to watch: $2.000, $4.000
Keep your long term vision!
Philip (BasicTrading)

ETHEREUM (ETHUSD): Back to Bullish Trend?!Ethereum is showing signs of recovery following a prolonged period of bearish movement.
A bullish breakout of a significant daily resistance level indicates strong buying activity.
I anticipate further market recovery with a potential target of reaching the 2,500 level in the near future.

one last dancegm.
you finally woke up and ethereum was soaring.
you saw the bounce. the reclaim. the headlines.
you convinced yourself the bottom was in.
you drew trendlines, watched influencers say “we’re so back.”
you wanted to believe.
and that’s exactly what wave B needed.
because this wasn't a breakout.
it’s a reset.
a psychological rinse,
engineered to bait late longs and build fuel for the final l i q u i d a t i o n.
this is the macro (W)-(X)-(Y).
not hopium, not dreams structure.
wave A brought devastation.
wave B brought complacency
wave C brings the execution.
make no mistake:
we’re not going up,
we’re being set up.
the chart says $742.
you call it impossible.
but the market doesn’t care what you believe.
the market only exists to find the maximum pain,
your maximum pain.
eth to $700 is not a prediction.
it’s a scheduled event.
and you’re RSVP’d unless you wake up.
wave C of wave (Y) is coming.
and it doesn’t care how bullish you feel.
---
ETHEREUM SHORT TO $786! (UPDATE)ETH dumping really hard as we expected on our last analysis! Scroll up to see our previous analysis. I said we'd see a drop down to 'Minor Wave 3' before a slow down & retracement back up towards 'Minor Wave 4' & that is exactly what has happened!
$786 still remains our Wave C target of my ‘Elliott Wave Theory’ strategy.

Ethereum (ETH/USD) – Breakout Strategy | Trade SetupEthereum (ETH/USD) – Breakout Strategy | Trade Setup | May 10, 2025
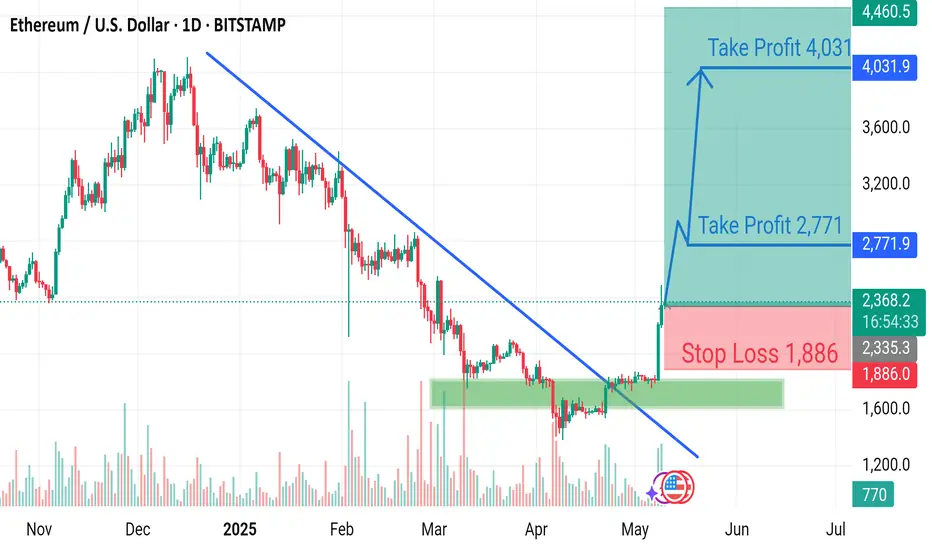
Ethereum has recently broken out of a major downtrend line, signaling a potential bullish reversal. This chart provides a well-structured technical setup with clear entry, stop-loss, and profit targets, designed for strategic trade planning.
Key Highlights:
Downtrend Breakout: ETH has broken a long-standing downward trendline, indicating renewed bullish momentum.
Confirmed Support Zone: The price rebounded from a strong support area around $2,335, reinforcing buyer interest.
Entry Price: $2,369.1 (current trading level)
Stop Loss: $1,886 – a key level to limit downside risk.
Take Profit 1: $2,771.9 – a conservative target for partial profit booking.
Take Profit 2: $4,031.9 – the extended target in case of continued bullish momentum.
Risk-to-Reward Ratio: Well-balanced and attractive for swing traders.
This setup offers a high-potential opportunity for traders looking to capitalize on Ethereum’s breakout. Always apply proper risk management and position sizing based on your trading strategy.
ETH : What the Options Are Saying (Hint: Big Move Ahead)Right now, Ethereum’s key players are positioning themselves to make some money on the rise.
And guess what? The market's already whispering where it’s headed next — but only if you know how to listen. And the loudest voice right now? Options flow on Deribit.
Let me break it down for you…
---
We caught some serious heat in the options pit lately. On Deribit, someone — or maybe a few someones — started stacking **Call options on ETH at 1,800 and 2,200 strike prices**, all under one portfolio. That’s not random. That’s a classic **Call Spread** setup, expiring June 27, 2025.
Translation? Someone’s betting hard on ETH heading north — straight toward **$2,200**.
But here's where it gets spicy. The **Max pain** for this contract sits right at **$2,000** — currently above spot price. Yeah, we’ve seen mixed stats on whether "price gravitates" to max pain like magic. But from experience? Right before expiry, price tends to *flirt* with that level.
So here's our read:
- There's **bullish sentiment** building.
- Eyes are locked on the **$2,200 zone** — likely within the next **30–50 days**.
- BTC’s playing the same game — big interest around **$100K–$110K strikes**, same expiry.
This isn’t noise. This is signal.
---
If you're tired of FOMO and want to catch the real setups before they blow up — follow. We turn complex flows into simple edge. Just actionable insights.
---
📈 *Trade smart. Stay sharp.
Join the crew that reads the market — not the hype.


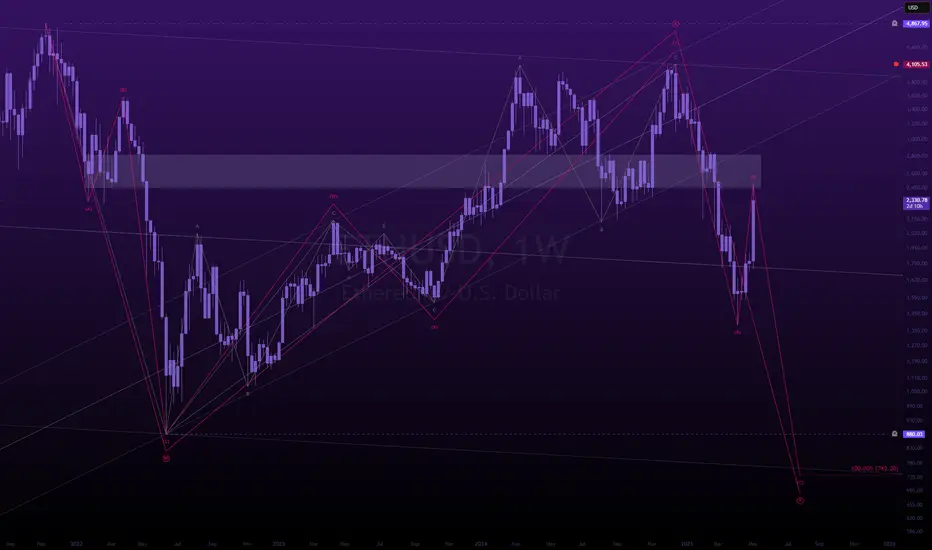
ETH(based on NEowave)Im sharing this because wave D is at the end and in the next 2 month you can see the main movement which is the start of wave E.
wave E takes about 350-450 days but after that there is a big and longtime bearish wave!

Ethereum Faces the 'Symplegades'– Will Pectra Propel It Through?Ethereum Faces the 'Symplegades' – Will Pectra Propel It Through?
⚔️🪨 Ethereum Faces the 'Symplegades' – Will Pectra Propel It Through? 🪨⚔️
In ancient Greek myth, the Symplegades — Clashing Rocks — tested Jason and the Argonauts with a narrow, deadly passage. Today, Ethereum faces its own mythic trial as price action presses into a critical zone.
📍 The $2,805–$2,848 resistance zone is acting like the Clashing Rocks — volatile, dangerous, and decisive. Beneath it, support rests near $2,616 and $2,565 . A breakout from this trap can open the way to $3,200+ , but rejection may mean another violent plunge. ⚠️
🔧 Enter: PECTRA – Ethereum’s Game-Changing Upgrade
Ethereum’s most ambitious upgrade since The Merge is nearly here. PECTRA isn’t just a backend update — it redefines how the network feels and functions:
🧠 Smarter Wallets
– Batch transactions
– Skip approval popups
– Pay gas in any token
⚡ Frictionless UX
– Fewer clicks
– No more endless “approve + confirm” loops
📉 Cheaper Transactions
– More blobs = better L2 scaling
– Lower fees, even during congestion
🌱 Staking Overhaul
– Validator cap raised to 2048 ETH
– Smart contract withdrawals
– Faster deposit recognition
🔓 Unlocking $490B in trapped value
– Assets become more accessible and usable
“The Merge changed how Ethereum works.
Pectra changes how it feels. ” – @ethereum
⛵ Will ETH Break Through the Clashing Rocks?
This is not just another consolidation box.
It’s a moment of mythic symmetry — where price action, fundamentals, and network transformation converge.
Sail through the Symplegades... or get crushed between them?
Stay sharp. Watch the breakout. The next move will be defining.
One Love,
The FXPROFESSOR 💙

ETH turned bullish on the daily chart, great R:R hereTargeting mid to upper 3000s in the mid-term (2-3 months) and expecting 5k plus by year end. ETH will get it's turn, don't worry

ETHUSD Ready for PUMP or what ?Currently, ETH is forming an ascending triangle, indicating a potential price increase. It is anticipated that the price could rise, aligning with the projected price movement (AB=CD).
Give me some energy !!
✨We spend hours finding potential opportunities and writing useful ideas, we would be happy if you support us.
Best regards CobraVanguard.💚
_ _ _ _ __ _ _ _ _ _ _ _ _ _ _ _ _ _ _ _ _ _ _ _ _ _ _ _ _ _ _ _
✅Thank you, and for more ideas, hit ❤️Like❤️ and 🌟Follow🌟!
⚠️Things can change...
The markets are always changing and even with all these signals, the market changes tend to be strong and fast!!

Ethereum Breakout: From Shadows to $11K+?Perfect — since the move is already playing out, here’s a long-form TradingView description that reflects the breakout in progress and builds a strong narrative around it:
---
Ethereum Breakout Confirmed — The Bull Run Has Begun
After months of downward pressure, Ethereum has finally broken free from its long-standing downtrend. The falling trendline that held ETH hostage since late 2024 has been decisively shattered, and price is now holding firm above the breakout zone. This isn’t just a breakout — it’s a shift in momentum.
We saw a strong bullish engulfing close above resistance, followed by healthy consolidation and a retest of the key zone around $1,740–$1,750, which now appears to be acting as solid support. That retest added weight to the breakout’s credibility — and the reaction since then has confirmed buyers are stepping back in with confidence.
Current price action is showing higher highs and higher lows, a classic structure of trend reversal. With this momentum and volume behind the move, the projected target stands tall at $11,452, giving this setup massive upside potential. The risk-to-reward ratio is excellent, and the technical picture couldn’t be clearer.
This isn’t just a short-term trade — it’s a potential multi-month macro move. If ETH maintains structure and broader market sentiment supports it, we could be witnessing the early stages of Ethereum’s next major bull cycle.
Levels to watch:
Entry Zone: $1,890–$1,900
Support: $1,744
Invalidation (SL): Below $1,740
Target: $11,452
Stay patient, manage risk, and ride the wave.

ETHUSD SHORT TERM BULLISH RETEST OF PREVIOUS SUPPORT/RESISTANCEAlthough the medium long term price target range for ETHUSD is the 900 price zone area, which is the previous lows on JUNE 2022, the short term consolidation price target remains the SEPTEMBER 2024 support at 2145,which should provide a strong platform for resistance for further advance in the short term. This should also coincide with BTCUSD retesting the previous All time highs @ 109k.

Ethereum waking up?One of the most disappointing projects in the crypto space in recent years has to be ETH, losing ground on BTC since September '22. Finally ETH looks to have woken up outpacing BTC this week and broken out from the daily downtrend channel and currently at the underside of the DAILY 200 EMA.
BTC.D has printed a SFP and dropped 2% from 65.4% to 63%, could we be seeing a rollover and rotation into altcoins?
How I see it the moving average should cap off this move for now and a retrace towards the breakout area & previous lower high. That would then be the first higher high and higher low of this calendar year, a very bullish change in structure.
A more aggressive bullish scenario in the short term would be a reclaim of the 1D 200 EMA, leaving the inefficiency zone at the breakout level unfilled.
Either way the next HTF target is $2,800 for ETH which would bring price to the range midpoint and a key supply zone with many resting Stop losses.

ETH gonna startWhen the Eth is 1500 -1600 dollars i said its the good time to buy this one
I think if you are holder the ETH just start and ATH can come in 3 or 6 months.

AI ETH Prediction for Next 6–24 Hours!May 4, 2025 4:21 pm. ETH/USD Trading Strategy
Timeframe: Short-Term (Next 6–24 Hours)
Long Scenario
- Entry: Break above 1833.50 (confirmed bullish momentum).
- Confirmation: MACD bullish crossover + RSI > 50.
- Stop-Loss (SL): 1818.00 (below support zone 1820–1825).
- Take-Profit (TP): 1838.00 (below resistance 1840).
- Trailing Stop: Activate at 1835.00, trail by 0.5%.
Short Scenario
- Entry : Drop below 1825.00 (bearish breakdown).
- Confirmation: Supertrend remains short + Stochastic RSI reversal.
- Stop-Loss (SL): 1836.00 (above resistance 1833.50).
- Take-Profit (TP): 1815.00 (above support 1815).
- Trailing Stop: Activate at 1820.00, trail by 0.5%.

ETH/USD bullish market structure with higher highs and higherloWCurrent Price: Around $2,412.63, with a +2.88% gain showing upward momentum.
Trend Structure:
Ethereum is moving within a rising parallel channel (light blue).
Inside the channel, there are zig-zag price movements, indicating a bullish market structure with higher highs and higher lows.
A strong breakout recently occurred from the lower part of the channel, pushing price sharply upward.
Trade Setup:
Buy zone is drawn inside the ascending channel.
Stop loss: Around $2,261.90, just below the lower boundary of the channel.
Target zone: Around $2,600, shown in green above the current price.
A pullback is anticipated before continuing upward, as shown by the arrow retracing and then moving toward the target.
Technical Notes:
The left side shows past consolidation and a breakout failure in late March, followed by a descending wedge into mid-April.
Since late April, ETH has entered a strong bullish rally, breaking above previous resistance.

Ether is following the up trend If Ethereum closes above $2,345 with strong volume, it suggests bulls are in control and could push prices toward the next resistance at $2,400.
Failure to Break: If Ethereum fails to move past $2,345 and gets rejected, it could indicate that selling pressure is too strong, leading to a pullback.
Retest & Confirmation: Sometimes, price may briefly break above resistance but fail to hold. A successful retest where the resistance turns into support strengthens bullish momentum.
Volume & Momentum: Higher trading volume near resistance suggests strong market interest. Weak volume near resistance may indicate an upcoming rejection.
Ethereum H4 | Potential bullish bounceEthereum (ETH/USD) is falling towards a multi-swing-low support and could potentially bounce off this level to climb higher.
Buy entry is at 1,732.25 which is a multi-swing-low support that aligns close to the 23.6% Fibonacci retracement.
Stop loss is at 1,650.00 which is a level that lies underneath a pullback support and the 38.2% Fibonacci retracement.
Take profit is at 1,938.37 which is an overlap resistance that aligns with the 78.6% Fibonacci retracement.
High Risk Investment Warning
Trading Forex/CFDs on margin carries a high level of risk and may not be suitable for all investors. Leverage can work against you.
Stratos Markets Limited (tradu.com):
CFDs are complex instruments and come with a high risk of losing money rapidly due to leverage. 63% of retail investor accounts lose money when trading CFDs with this provider. You should consider whether you understand how CFDs work and whether you can afford to take the high risk of losing your money.
Stratos Europe Ltd (tradu.com):
CFDs are complex instruments and come with a high risk of losing money rapidly due to leverage. 63% of retail investor accounts lose money when trading CFDs with this provider. You should consider whether you understand how CFDs work and whether you can afford to take the high risk of losing your money.
Stratos Global LLC (tradu.com):
Losses can exceed deposits.
Please be advised that the information presented on TradingView is provided to Tradu (‘Company’, ‘we’) by a third-party provider (‘TFA Global Pte Ltd’). Please be reminded that you are solely responsible for the trading decisions on your account. There is a very high degree of risk involved in trading. Any information and/or content is intended entirely for research, educational and informational purposes only and does not constitute investment or consultation advice or investment strategy. The information is not tailored to the investment needs of any specific person and therefore does not involve a consideration of any of the investment objectives, financial situation or needs of any viewer that may receive it. Kindly also note that past performance is not a reliable indicator of future results. Actual results may differ materially from those anticipated in forward-looking or past performance statements. We assume no liability as to the accuracy or completeness of any of the information and/or content provided herein and the Company cannot be held responsible for any omission, mistake nor for any loss or damage including without limitation to any loss of profit which may arise from reliance on any information supplied by TFA Global Pte Ltd.
The speaker(s) is neither an employee, agent nor representative of Tradu and is therefore acting independently. The opinions given are their own, constitute general market commentary, and do not constitute the opinion or advice of Tradu or any form of personal or investment advice. Tradu neither endorses nor guarantees offerings of third-party speakers, nor is Tradu responsible for the content, veracity or opinions of third-party speakers, presenters or participants.

An important bifurcation point in the market, we are reducing poTo date, the market has shown itself quite positively, but, as I wrote earlier, it will be possible to talk about a trend change only after the opening of the second half of the quarter. The first half is so far only a pullback and retest of the broken key levels in the first quarter. Today and tomorrow we are passing an important bifurcation point. At the moment, 2500 for ether and 100k for bitcoin are only retest levels. However, over the past two weeks, the chances of a trend change have increased significantly, where the targets may be 210k for bitcoin and up to 7500k for ether. This scenario is possible when the second half of the quarter opens above 2500 and 100k, respectively. Oil growth in the new week, weak statistics on the United States in the second half of the week, or strong GDP in Europe and Britain, as well as a possible temporary truce in Ukraine, which will give impulses to the stock market and the cryptocurrency market, including.
The seasonal sales wave begins on May 11-12. In a positive scenario, today and tomorrow, the ether will be able to take 2500 and the new week will open above the level. In this case, in the first half of the week, we will only see sales within the shadow of a new weekly candle, and from Tuesday to Wednesday, the altcoin market will begin to return to growth, which may last until the end of the half–year if the second half of the quarter also opens above 2500. In this scenario, most coins will additionally show an increase of up to 50-150% from current levels.
In a more negative and technically more likely scenario, the new week will open below 2500, which will lead to a significant drop in the altcoin market at the beginning of the week and a return of ether to 1900-2000 with a further struggle for a new test of 2500 before the end of the month or continued sales to 1400-1500.
Due to the dangerous situation, it is worthwhile to carefully weigh the amount of funds in the work and reduce positions with further additions to coins in the event of a week opening above 2500 on ether. The most undervalued today are only fantokens, which can show good growth even in a negative market, as they will remain the most interesting option for speculators in the event of a drawdown of ether. Among them, I am primarily considering atm city and acm. It is also worth keeping an eye on coins with the monitoring tag, as they are sold most actively when the market correction is approaching. They can also contribute to the overall drawdown of altcoins.

Ethereum's $2k Crossroads: Squeeze Up or Crash Down?Ethereum at a Crossroads: Eyeing $2,000 Amidst Short Squeeze Hopes, Crash Warnings, and Existential Questions
Ethereum (ETH), the bedrock of decentralized finance (DeFi) and the engine behind countless non-fungible tokens (NFTs), finds itself ensnared in a complex web of conflicting market signals and divergent analyst opinions. On one hand, recent price action shows resilience, with ETH powering through previous resistance levels and setting its sights on the psychologically significant $2,000 mark. This move is potentially bolstered by intriguing on-chain data, such as declining supply on major exchanges like Binance, sparking whispers of an impending short squeeze. Yet, casting a long shadow over this optimism are stark warnings: technical analysts point to rare, potentially bearish patterns forming, prominent trading firms question its fundamental value proposition compared to Bitcoin (BTC), highlighting its staggering year-to-date losses, and some even provocatively label it more akin to a "memecoin."
This cacophony of bullish hopes and bearish alerts places Ethereum at a critical juncture. Is the recent surge the beginning of a sustained recovery, fueled by tightening supply and renewed developer activity? Or is it merely a deceptive bounce within a larger downtrend, vulnerable to a potential crash as underlying weaknesses and unfavorable comparisons to Bitcoin take hold? Dissecting these opposing narratives is crucial for understanding the intense battleground Ethereum's price chart has become.
The Bullish Ascent: Powering Through Resistance, Eyeing $2,000
The immediate catalyst for renewed optimism stems from Ethereum's recent price performance. After a period of consolidation and, at times, significant downward pressure, ETH has demonstrated notable strength. Headlines proclaiming "Ethereum Price Powers Through Resistance — Eyes on $2,000?" capture this sentiment. Breaking through previously established resistance levels (potentially building on support found around the $1,800 mark) is a technically significant event. It suggests buyers are stepping in with enough conviction to overcome selling pressure that had previously capped advances.
Successfully reclaiming and holding levels above former resistance transforms these zones into potential new support floors, providing a base for further upward movement. The $2,000 level looms large, not just as a round number, but often as a key area of historical price interaction – a zone where significant buying or selling interest has previously materialized. A decisive break above $2,000 could inject further confidence into the market, potentially attracting momentum traders and reinforcing the bullish narrative.
The Binance Supply Drop and Short Squeeze Speculation
Adding intrigue to the bullish case is the observation of declining Ether supply on major exchanges, specifically Binance. Exchange supply is a closely watched metric. When the amount of ETH held on exchanges decreases, it generally implies that investors are withdrawing their coins to private wallets, often for longer-term holding ("HODLing") or for use within the DeFi ecosystem (staking, lending, etc.). This reduction in readily available supply on exchanges can, in theory, create a tighter market.
This dynamic fuels speculation about a potential "short squeeze." A short squeeze occurs when the price of an asset starts to rise rapidly, forcing traders who had bet against it (short sellers) to buy back the asset to close their positions and cut their losses. This forced buying adds further upward pressure on the price, creating a rapid, cascading effect. If a significant number of traders have shorted ETH, anticipating further price declines, a sustained move upwards coupled with shrinking exchange supply could create the conditions for such a squeeze, dramatically accelerating the price towards and potentially beyond the $2,000 target. While short squeezes are relatively rare and difficult to predict accurately, the declining supply on a major platform like Binance certainly adds a compelling element to the bullish thesis.
Underlying Strengths: The Long-Term Vision
Beyond short-term price action and supply dynamics, Ethereum's bulls point to its fundamental strengths. The successful transition to Proof-of-Stake (PoS) via "The Merge" was a monumental technical achievement, drastically reducing the network's energy consumption and changing its tokenomics by potentially making ETH a deflationary asset under certain conditions (where more ETH is "burned" via transaction fees than is issued as staking rewards). Ongoing scalability upgrades, often referred to under the umbrella of Ethereum 2.0 developments (like proto-danksharding via EIP-4844), aim to reduce transaction fees and increase throughput, making the network more efficient and attractive for developers and users.
Ethereum remains the dominant platform for smart contracts, DeFi applications, and NFT marketplaces. Its vast developer community, established network effects, and continuous innovation pipeline are often cited as core long-term value drivers that short-term price volatility cannot erase. For believers in Ethereum's vision, the current price levels, even after the recent bounce, might represent an opportunity to accumulate an asset with significant future potential.
The Bearish Counter-Narrative: Red Alerts and Worrying Comparisons
However, the optimism is heavily tempered by significant bearish signals and critiques. This serves as a stark warning. Technical analysis involves studying chart patterns and indicators to forecast future price movements. While the specific "rare pattern" isn't detailed, the emergence of such signals often causes significant concern among traders. Patterns like head-and-shoulders tops, descending triangles, or bearish divergences on key indicators can suggest that upward momentum is waning and a significant price decline could be imminent. Such technical warnings cannot be easily dismissed, especially when they align with other concerning factors.
The Stark Reality: Underperformance and the "Memecoin" Jab
Perhaps the most damaging critique comes from the direct comparison with Bitcoin and the assessment of Ethereum's recent performance. A large year-to-date drop is a brutal statistic, especially when Bitcoin, while also volatile, may have fared comparatively better during the same period (depending on the exact timeframe and BTC's own fluctuations).
Why the "memecoin" comparison? Memecoins are typically characterized by extreme volatility, price movements driven largely by social media hype and sentiment rather than clear fundamental value, and a lack of a distinct, widely accepted use case beyond speculation. While some calling Ethereum a memecoin is hyperbolic – given its vast ecosystem and utility – the critique likely stems from its recent high volatility and its struggle to maintain value relative to Bitcoin. The trading firm's assertion that Ether's "risk-reward is now unjustifiable compared to Bitcoin" encapsulates this view. They likely argue that Bitcoin's clearer narrative as a potential store of value or "digital gold," potentially bolstered by institutional adoption via ETFs, offers a more compelling investment case with potentially less downside risk compared to Ethereum, which faces ongoing scalability challenges, competition from other Layer 1 blockchains, and perhaps greater regulatory uncertainty regarding its status (security vs. commodity).
This underperformance raises difficult questions. If Ethereum is the backbone of Web3, why has its price struggled so much relative to its peers or even its own potential? Possible contributing factors include:
1. Capital Rotation: The excitement and capital inflows surrounding spot Bitcoin ETFs may have drawn investment away from Ethereum and other altcoins.
2. Regulatory Uncertainty: Ongoing debates, particularly in the US, about whether ETH should be classified as a security could be creating hesitancy among institutional investors.
3. Competition: Numerous alternative Layer 1 blockchains (Solana, Avalanche, etc.) are competing fiercely for developers and users, potentially fragmenting the market share Ethereum once dominated.
4. Post-Merge Narrative Shift: While technically successful, the immediate post-Merge price action was underwhelming for many, and the narrative focus may have shifted elsewhere.
Synthesizing the Dichotomy: A Market Divided
Ethereum's current situation is a textbook example of a market grappling with deeply conflicting data points and narratives.
• Bullish Signals: Price breaking resistance, targeting $2k, falling exchange supply, potential short squeeze, ongoing network development, strong ecosystem.
• Bearish Signals: Severe YTD underperformance, concerning technical patterns ("red alert"), critical comparisons to Bitcoin's risk/reward, being labeled "memecoin-like" by traders, regulatory overhang, Layer 1 competition.
This dichotomy creates significant uncertainty. Is the falling supply on Binance a sign of HODLer conviction paving the way for a short squeeze, or simply users moving assets to DeFi protocols, with little bearing on immediate price direction? Is the push towards $2,000 the start of a real trend reversal, or a bull trap set by bearish technical patterns? Is Ethereum's fundamental value being overlooked amidst short-term noise, or are the critiques about its risk/reward profile relative to Bitcoin valid warnings?
Investor Sentiment and Key Factors to Watch
This environment fosters polarized investor sentiment. Optimists see a buying opportunity, focusing on the recent strength and long-term potential. Pessimists see confirmation of underlying weakness and prepare for further declines. The path forward will likely be determined by several key factors:
1. Bitcoin's Trajectory: As the market leader, Bitcoin's price action heavily influences the broader crypto market, including Ethereum. Continued strength in BTC could provide a tailwind for ETH.
2. Technical Levels: Whether ETH can decisively breach and hold $2,000, or if it gets rejected, will be a critical short-term indicator. Equally important is whether current support levels hold during any pullbacks.
3. Exchange Flows & On-Chain Data: Continued monitoring of exchange supply, staking activity, and transaction volumes will provide clues about investor behavior.
4. Regulatory Developments: Any clarification on Ethereum's regulatory status, particularly in the US, could significantly impact sentiment.
5. Macroeconomic Environment: Broader market risk appetite, influenced by inflation, interest rates, and economic growth prospects, will continue to play a role.
Conclusion: Navigating Ethereum's Uncertain Path
Ethereum stands at a precarious crossroads. The recent climb towards $2,000, supported by encouraging signs like falling exchange supply, offers a glimmer of hope for bulls anticipating a recovery and perhaps even a short squeeze. However, this optimism is aggressively challenged by alarming technical warnings, significant underperformance compared to market expectations and Bitcoin, and pointed critiques questioning its current investment viability.
The "memecoin" comparison, while harsh, reflects a genuine frustration and concern among some market observers about ETH's volatility and perceived lack of decisive direction relative to the "digital gold" narrative solidifying around Bitcoin. The formation of rare bearish patterns adds a layer of technical urgency to these concerns.
Ultimately, the market remains deeply divided on Ethereum's immediate future. The battle between the potential for a supply-driven squeeze towards $2,000 and the risk of a pattern-induced crash is palpable. Investors must weigh the platform's undeniable long-term technological significance and ecosystem strength against the immediate headwinds of poor recent performance, regulatory ambiguity, and concerning technical signals. The coming weeks are likely to be crucial in determining whether Ethereum can overcome the prevailing skepticism and validate the recent bullish momentum, or if the bears will regain control, confirming the warnings of a continued downturn. The price action around the $2,000 level will be a key battleground in this ongoing struggle.
Disclaimer: The information presented in this article is for informational and educational purposes only. It is based on the analysis of the provided headlines and general market knowledge. It does not constitute financial advice. Investing in cryptocurrencies involves significant risk, including the potential loss of principal. Readers should conduct their own thorough research and consult with a qualified financial advisor before making any investment decisions.

Ether 6k Until next year i think ether will hit 6000$ per coin.
Higher time frame is bullish.
Nothing will stop this sleeping giant.
