Be careful with ETH !!!now is the time for ETH to rise again to 1900 . STRONG SUPPORT 1530 .
Give me some energy !!
✨We spend hours finding potential opportunities and writing useful ideas, we would be happy if you support us.
Best regards CobraVanguard.💚
_ _ _ _ __ _ _ _ _ _ _ _ _ _ _ _ _ _ _ _ _ _ _ _ _ _ _ _ _ _ _ _
✅Thank you, and for more ideas, hit ❤️Like❤️ and 🌟Follow🌟!
⚠️Things can change...
The markets are always changing and even with all these signals, the market changes tend to be strong and fast!!
ETHEREUM trade ideas


Bull run over the weekend amid strong signals for market growthTo date, the crypt has been given a number of positive factors and the basis for a very stormy weekend.
Binance monitoring did not give a new assignment of the tag, which was immediately responded to by pivx, which I recommended for work. I think the holidays in China had an impact. In the new rules for assigning the binance tag, it obviously means the first working week of the month. Apparently, the assignment of the tag can be expected from Tuesday with the start of the working week in China.
This week, almost all important statistics on the United States came out negative, in addition to last week. For oil, the same picture is for purchases.
The combination of these factors sets the stage for an attempt at an annual turnaround of the crypt with disruptions to the tops. It's too early to talk about the consolidation of such a scenario before the second half of the month, but the signal itself for a possible trend for bitcoin at 210k and ether at 5000k+ sets the stage for a bull run on altcoins.
Due to this picture, a very stormy weekend is likely ahead, followed by a correction in tag assignment and a new wave of growth in the second half of the coming week.
This weekend, first of all, we can expect bull runs on fantokens, which remained the most oversold instruments after another delisting, which makes them extremely attractive to speculators. First of all, I am considering atm city acm asr. Their breakout potential is up to 3-5X, depending on volatility.
Among altcoins, bifi fio chess retains a good potential for breakouts of similar pivx. A repeated pulse on pivx can be considered already in the case of the start of a bull run. According to these coins, growth impulses of up to 50-70% are likely. Koma is also in an interesting position on binance alpha, which can show growth up to 0.050-75.

Why Ethereum Could 10x in the Next Few Years🚀
1. Ethereum ETF Approval
ETFs are approved in the U.S. (similar to the Bitcoin ETFs in early 2024), institutional money will flood in.
Grayscale, BlackRock, and others have already filed.
Ethereum’s price jumped significantly after similar events in the past.
2. Deflationary Supply (Post-EIP-1559)
Since EIP-1559, ETH has been burned with every transaction.
Combined with Proof-of-Stake (The Merge), ETH is now net deflationary during periods of high network activity.
3. Layer 2 Ecosystem Is Exploding
Rollups (Arbitrum, Optimism, Base, zkSync) are scaling Ethereum.
These L2s settle on Ethereum L1, driving fees and activity.
Vitalik’s "rollup-centric roadmap" is playing out — this benefits ETH long-term.
4. Real Yield from Staking
Ethereum now offers a real, sustainable yield from staking (~3–5%).
Institutions love yield. ETH becomes more like a productive asset, not just a speculative token.
5. Ethereum as the Base Layer of Web3
DeFi, NFTs, gaming, DAOs — Ethereum is still the dominant smart contract platform.
The most secure, battle-tested, and widely adopted chain.
Developers and enterprises continue to build on Ethereum over competitors.
6. Macro Tailwinds
As the U.S. moves toward looser monetary policy, risk assets (including crypto) historically benefit.
Crypto adoption is growing globally — from Latin America to Asia — and Ethereum is often the entry point.

ETHEREUM NEXT BIG MOVE: Smart Money Accumulation? | ETH/USD Chart timeframe: 6H | Exchange: Coinbase
Price at post: $1,816
Ethereum is currently consolidating inside a major demand zone between $1,536 – $1,850, where we’ve seen multiple strong rejections to the downside. This orange zone represents a key institutional accumulation range. Price has tested this area multiple times, building a strong base of support.
Key Technical Highlights:
Demand Zone (Highlighted in Orange): ETH has respected this zone since April, showing accumulation by smart money.
Supply Zone (Blue Zone): Major resistance starts around $2,637, with peak volume interest visible up to $3,557 – a key profit-taking zone if the bullish breakout occurs.
Visible Range Volume Profile: Clearly shows heavy past activity in the upper blue zone. If ETH reclaims $2,000+, expect volume-driven momentum into $2,637 and potentially $3,557.
Bullish Structure Potential: The pattern is forming a potential Wyckoff Accumulation, with Spring & Test around $1,536. Watch for a breakout above $2,000 to confirm a bullish trend reversal.
Short-Term Plan:
Bullish Confirmation Above: $2,000 – look for breakout volume and candle close on the 6H/1D timeframe.
Targets: $2,637 (first take profit), $3,557 (major supply zone).
Invalidation: Break and close below $1,500.
Outlook:
Ethereum looks poised for a significant breakout if the current range holds. Watch for bullish confirmation above key levels, especially as volume begins to rise. The current consolidation might be the calm before a powerful move – don’t miss it.
Do you think ETH will break out or break down? Comment your bias below!
If you found this helpful, like and follow for more smart money breakdowns.
#ETHUSD #Ethereum #CryptoTrading #SmartMoney #SupplyAndDemand #Wyckoff #LuxAlgo #TradingView #Altcoins #Bitcoin

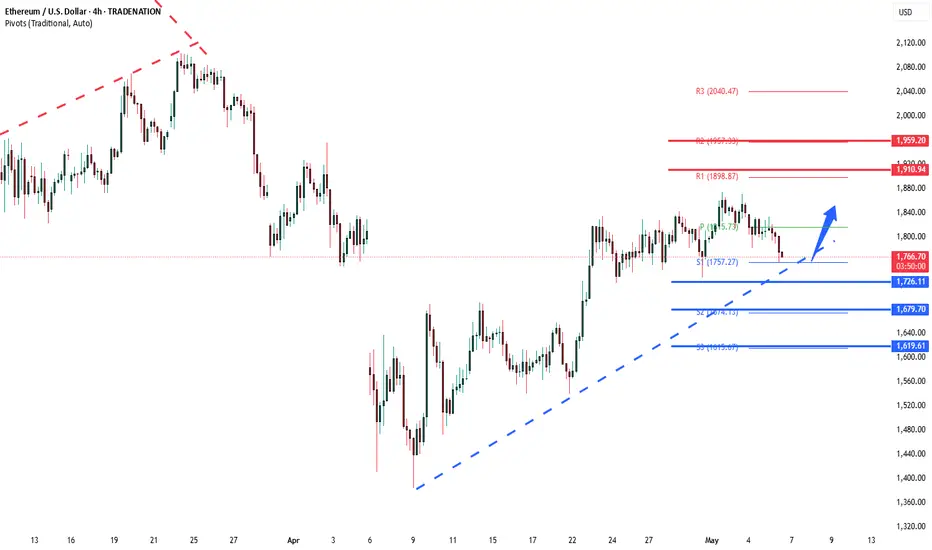
ETHUSD INTRADAY rising support retestETH/USD maintains a bullish sentiment, supported by an ongoing upward trend. However, recent intraday price action shows signs of sideways consolidation, suggesting a pause or potential setup before the next significant move.
Key Levels:
Support: 1,726 (primary), followed by 1,680 and 1,620
Resistance: 1,910, with extended targets at 1,960 and 2,020
The 1,726 level serves as a critical pivot point, marking a previous consolidation zone. A pullback toward this level followed by a bullish rebound could reaffirm the uptrend and set the stage for a move toward the 1,910 resistance. A breakout above 1,910 would likely open the path to higher targets at 1,960 and 2,020 over the medium to long term.
On the other hand, a daily close below 1,726 would weaken the bullish structure and could trigger a deeper retracement toward 1,680 and potentially 1,620.
Conclusion:
ETH/USD remains in a bullish trend, but short-term consolidation may precede the next leg up. Traders should monitor the 1,726 support level closely—its defense could signal trend continuation, while a breakdown would increase downside risk.
This communication is for informational purposes only and should not be viewed as any form of recommendation as to a particular course of action or as investment advice. It is not intended as an offer or solicitation for the purchase or sale of any financial instrument or as an official confirmation of any transaction. Opinions, estimates and assumptions expressed herein are made as of the date of this communication and are subject to change without notice. This communication has been prepared based upon information, including market prices, data and other information, believed to be reliable; however, Trade Nation does not warrant its completeness or accuracy. All market prices and market data contained in or attached to this communication are indicative and subject to change without notice.
Ethereum H4 | Potential bullish bounceEthereum (ETH/USD) is falling towards a multi-swing-low support and could potentially bounce off this level to climb higher.
Buy entry is at 1,732.25 which is a multi-swing-low support that aligns close to the 23.6% Fibonacci retracement.
Stop loss is at 1,650.00 which is a level that lies underneath a pullback support and the 38.2% Fibonacci retracement.
Take profit is at 1,938.37 which is an overlap resistance that aligns with the 78.6% Fibonacci retracement.
High Risk Investment Warning
Trading Forex/CFDs on margin carries a high level of risk and may not be suitable for all investors. Leverage can work against you.
Stratos Markets Limited (tradu.com):
CFDs are complex instruments and come with a high risk of losing money rapidly due to leverage. 63% of retail investor accounts lose money when trading CFDs with this provider. You should consider whether you understand how CFDs work and whether you can afford to take the high risk of losing your money.
Stratos Europe Ltd (tradu.com):
CFDs are complex instruments and come with a high risk of losing money rapidly due to leverage. 63% of retail investor accounts lose money when trading CFDs with this provider. You should consider whether you understand how CFDs work and whether you can afford to take the high risk of losing your money.
Stratos Global LLC (tradu.com):
Losses can exceed deposits.
Please be advised that the information presented on TradingView is provided to Tradu (‘Company’, ‘we’) by a third-party provider (‘TFA Global Pte Ltd’). Please be reminded that you are solely responsible for the trading decisions on your account. There is a very high degree of risk involved in trading. Any information and/or content is intended entirely for research, educational and informational purposes only and does not constitute investment or consultation advice or investment strategy. The information is not tailored to the investment needs of any specific person and therefore does not involve a consideration of any of the investment objectives, financial situation or needs of any viewer that may receive it. Kindly also note that past performance is not a reliable indicator of future results. Actual results may differ materially from those anticipated in forward-looking or past performance statements. We assume no liability as to the accuracy or completeness of any of the information and/or content provided herein and the Company cannot be held responsible for any omission, mistake nor for any loss or damage including without limitation to any loss of profit which may arise from reliance on any information supplied by TFA Global Pte Ltd.
The speaker(s) is neither an employee, agent nor representative of Tradu and is therefore acting independently. The opinions given are their own, constitute general market commentary, and do not constitute the opinion or advice of Tradu or any form of personal or investment advice. Tradu neither endorses nor guarantees offerings of third-party speakers, nor is Tradu responsible for the content, veracity or opinions of third-party speakers, presenters or participants.

Ethereum's $2k Crossroads: Squeeze Up or Crash Down?Ethereum at a Crossroads: Eyeing $2,000 Amidst Short Squeeze Hopes, Crash Warnings, and Existential Questions
Ethereum (ETH), the bedrock of decentralized finance (DeFi) and the engine behind countless non-fungible tokens (NFTs), finds itself ensnared in a complex web of conflicting market signals and divergent analyst opinions. On one hand, recent price action shows resilience, with ETH powering through previous resistance levels and setting its sights on the psychologically significant $2,000 mark. This move is potentially bolstered by intriguing on-chain data, such as declining supply on major exchanges like Binance, sparking whispers of an impending short squeeze. Yet, casting a long shadow over this optimism are stark warnings: technical analysts point to rare, potentially bearish patterns forming, prominent trading firms question its fundamental value proposition compared to Bitcoin (BTC), highlighting its staggering year-to-date losses, and some even provocatively label it more akin to a "memecoin."
This cacophony of bullish hopes and bearish alerts places Ethereum at a critical juncture. Is the recent surge the beginning of a sustained recovery, fueled by tightening supply and renewed developer activity? Or is it merely a deceptive bounce within a larger downtrend, vulnerable to a potential crash as underlying weaknesses and unfavorable comparisons to Bitcoin take hold? Dissecting these opposing narratives is crucial for understanding the intense battleground Ethereum's price chart has become.
The Bullish Ascent: Powering Through Resistance, Eyeing $2,000
The immediate catalyst for renewed optimism stems from Ethereum's recent price performance. After a period of consolidation and, at times, significant downward pressure, ETH has demonstrated notable strength. Headlines proclaiming "Ethereum Price Powers Through Resistance — Eyes on $2,000?" capture this sentiment. Breaking through previously established resistance levels (potentially building on support found around the $1,800 mark) is a technically significant event. It suggests buyers are stepping in with enough conviction to overcome selling pressure that had previously capped advances.
Successfully reclaiming and holding levels above former resistance transforms these zones into potential new support floors, providing a base for further upward movement. The $2,000 level looms large, not just as a round number, but often as a key area of historical price interaction – a zone where significant buying or selling interest has previously materialized. A decisive break above $2,000 could inject further confidence into the market, potentially attracting momentum traders and reinforcing the bullish narrative.
The Binance Supply Drop and Short Squeeze Speculation
Adding intrigue to the bullish case is the observation of declining Ether supply on major exchanges, specifically Binance. Exchange supply is a closely watched metric. When the amount of ETH held on exchanges decreases, it generally implies that investors are withdrawing their coins to private wallets, often for longer-term holding ("HODLing") or for use within the DeFi ecosystem (staking, lending, etc.). This reduction in readily available supply on exchanges can, in theory, create a tighter market.
This dynamic fuels speculation about a potential "short squeeze." A short squeeze occurs when the price of an asset starts to rise rapidly, forcing traders who had bet against it (short sellers) to buy back the asset to close their positions and cut their losses. This forced buying adds further upward pressure on the price, creating a rapid, cascading effect. If a significant number of traders have shorted ETH, anticipating further price declines, a sustained move upwards coupled with shrinking exchange supply could create the conditions for such a squeeze, dramatically accelerating the price towards and potentially beyond the $2,000 target. While short squeezes are relatively rare and difficult to predict accurately, the declining supply on a major platform like Binance certainly adds a compelling element to the bullish thesis.
Underlying Strengths: The Long-Term Vision
Beyond short-term price action and supply dynamics, Ethereum's bulls point to its fundamental strengths. The successful transition to Proof-of-Stake (PoS) via "The Merge" was a monumental technical achievement, drastically reducing the network's energy consumption and changing its tokenomics by potentially making ETH a deflationary asset under certain conditions (where more ETH is "burned" via transaction fees than is issued as staking rewards). Ongoing scalability upgrades, often referred to under the umbrella of Ethereum 2.0 developments (like proto-danksharding via EIP-4844), aim to reduce transaction fees and increase throughput, making the network more efficient and attractive for developers and users.
Ethereum remains the dominant platform for smart contracts, DeFi applications, and NFT marketplaces. Its vast developer community, established network effects, and continuous innovation pipeline are often cited as core long-term value drivers that short-term price volatility cannot erase. For believers in Ethereum's vision, the current price levels, even after the recent bounce, might represent an opportunity to accumulate an asset with significant future potential.
The Bearish Counter-Narrative: Red Alerts and Worrying Comparisons
However, the optimism is heavily tempered by significant bearish signals and critiques. This serves as a stark warning. Technical analysis involves studying chart patterns and indicators to forecast future price movements. While the specific "rare pattern" isn't detailed, the emergence of such signals often causes significant concern among traders. Patterns like head-and-shoulders tops, descending triangles, or bearish divergences on key indicators can suggest that upward momentum is waning and a significant price decline could be imminent. Such technical warnings cannot be easily dismissed, especially when they align with other concerning factors.
The Stark Reality: Underperformance and the "Memecoin" Jab
Perhaps the most damaging critique comes from the direct comparison with Bitcoin and the assessment of Ethereum's recent performance. A large year-to-date drop is a brutal statistic, especially when Bitcoin, while also volatile, may have fared comparatively better during the same period (depending on the exact timeframe and BTC's own fluctuations).
Why the "memecoin" comparison? Memecoins are typically characterized by extreme volatility, price movements driven largely by social media hype and sentiment rather than clear fundamental value, and a lack of a distinct, widely accepted use case beyond speculation. While some calling Ethereum a memecoin is hyperbolic – given its vast ecosystem and utility – the critique likely stems from its recent high volatility and its struggle to maintain value relative to Bitcoin. The trading firm's assertion that Ether's "risk-reward is now unjustifiable compared to Bitcoin" encapsulates this view. They likely argue that Bitcoin's clearer narrative as a potential store of value or "digital gold," potentially bolstered by institutional adoption via ETFs, offers a more compelling investment case with potentially less downside risk compared to Ethereum, which faces ongoing scalability challenges, competition from other Layer 1 blockchains, and perhaps greater regulatory uncertainty regarding its status (security vs. commodity).
This underperformance raises difficult questions. If Ethereum is the backbone of Web3, why has its price struggled so much relative to its peers or even its own potential? Possible contributing factors include:
1. Capital Rotation: The excitement and capital inflows surrounding spot Bitcoin ETFs may have drawn investment away from Ethereum and other altcoins.
2. Regulatory Uncertainty: Ongoing debates, particularly in the US, about whether ETH should be classified as a security could be creating hesitancy among institutional investors.
3. Competition: Numerous alternative Layer 1 blockchains (Solana, Avalanche, etc.) are competing fiercely for developers and users, potentially fragmenting the market share Ethereum once dominated.
4. Post-Merge Narrative Shift: While technically successful, the immediate post-Merge price action was underwhelming for many, and the narrative focus may have shifted elsewhere.
Synthesizing the Dichotomy: A Market Divided
Ethereum's current situation is a textbook example of a market grappling with deeply conflicting data points and narratives.
• Bullish Signals: Price breaking resistance, targeting $2k, falling exchange supply, potential short squeeze, ongoing network development, strong ecosystem.
• Bearish Signals: Severe YTD underperformance, concerning technical patterns ("red alert"), critical comparisons to Bitcoin's risk/reward, being labeled "memecoin-like" by traders, regulatory overhang, Layer 1 competition.
This dichotomy creates significant uncertainty. Is the falling supply on Binance a sign of HODLer conviction paving the way for a short squeeze, or simply users moving assets to DeFi protocols, with little bearing on immediate price direction? Is the push towards $2,000 the start of a real trend reversal, or a bull trap set by bearish technical patterns? Is Ethereum's fundamental value being overlooked amidst short-term noise, or are the critiques about its risk/reward profile relative to Bitcoin valid warnings?
Investor Sentiment and Key Factors to Watch
This environment fosters polarized investor sentiment. Optimists see a buying opportunity, focusing on the recent strength and long-term potential. Pessimists see confirmation of underlying weakness and prepare for further declines. The path forward will likely be determined by several key factors:
1. Bitcoin's Trajectory: As the market leader, Bitcoin's price action heavily influences the broader crypto market, including Ethereum. Continued strength in BTC could provide a tailwind for ETH.
2. Technical Levels: Whether ETH can decisively breach and hold $2,000, or if it gets rejected, will be a critical short-term indicator. Equally important is whether current support levels hold during any pullbacks.
3. Exchange Flows & On-Chain Data: Continued monitoring of exchange supply, staking activity, and transaction volumes will provide clues about investor behavior.
4. Regulatory Developments: Any clarification on Ethereum's regulatory status, particularly in the US, could significantly impact sentiment.
5. Macroeconomic Environment: Broader market risk appetite, influenced by inflation, interest rates, and economic growth prospects, will continue to play a role.
Conclusion: Navigating Ethereum's Uncertain Path
Ethereum stands at a precarious crossroads. The recent climb towards $2,000, supported by encouraging signs like falling exchange supply, offers a glimmer of hope for bulls anticipating a recovery and perhaps even a short squeeze. However, this optimism is aggressively challenged by alarming technical warnings, significant underperformance compared to market expectations and Bitcoin, and pointed critiques questioning its current investment viability.
The "memecoin" comparison, while harsh, reflects a genuine frustration and concern among some market observers about ETH's volatility and perceived lack of decisive direction relative to the "digital gold" narrative solidifying around Bitcoin. The formation of rare bearish patterns adds a layer of technical urgency to these concerns.
Ultimately, the market remains deeply divided on Ethereum's immediate future. The battle between the potential for a supply-driven squeeze towards $2,000 and the risk of a pattern-induced crash is palpable. Investors must weigh the platform's undeniable long-term technological significance and ecosystem strength against the immediate headwinds of poor recent performance, regulatory ambiguity, and concerning technical signals. The coming weeks are likely to be crucial in determining whether Ethereum can overcome the prevailing skepticism and validate the recent bullish momentum, or if the bears will regain control, confirming the warnings of a continued downturn. The price action around the $2,000 level will be a key battleground in this ongoing struggle.
Disclaimer: The information presented in this article is for informational and educational purposes only. It is based on the analysis of the provided headlines and general market knowledge. It does not constitute financial advice. Investing in cryptocurrencies involves significant risk, including the potential loss of principal. Readers should conduct their own thorough research and consult with a qualified financial advisor before making any investment decisions.

Ether 6k Until next year i think ether will hit 6000$ per coin.
Higher time frame is bullish.
Nothing will stop this sleeping giant.

Ethereum Breakout + Institutional Support = Bullish Potential
ETHUSD has decisively broken above its long-term descending trendline, showing early signs of a bullish trend reversal. With a bullish price structure forming above the $1,740 support zone, eyes are on the potential rally toward $4,100.
The Commitment of Traders (COT) data adds weight to the move:
88.31% of non-commercial positions are long as of April 27.
Net positions turned positive, reflecting renewed institutional confidence.
Open interest is rising steadily, and short positions are being reduced.
The technical breakout, aligned with bullish sentiment among smart money traders, presents a compelling setup.
Target: $4,135
Stop Loss Zone: Below $1,335
Watch Levels: $1,744 (key structure), $2,400 (interim resistance)

AI ETH Prediction for Next 6–24 Hours!May 4, 2025 4:21 pm. ETH/USD Trading Strategy
Timeframe: Short-Term (Next 6–24 Hours)
Long Scenario
- Entry: Break above 1833.50 (confirmed bullish momentum).
- Confirmation: MACD bullish crossover + RSI > 50.
- Stop-Loss (SL): 1818.00 (below support zone 1820–1825).
- Take-Profit (TP): 1838.00 (below resistance 1840).
- Trailing Stop: Activate at 1835.00, trail by 0.5%.
Short Scenario
- Entry : Drop below 1825.00 (bearish breakdown).
- Confirmation: Supertrend remains short + Stochastic RSI reversal.
- Stop-Loss (SL): 1836.00 (above resistance 1833.50).
- Take-Profit (TP): 1815.00 (above support 1815).
- Trailing Stop: Activate at 1820.00, trail by 0.5%.

Eth looking promising for a bull runHi guys, I do these charts often as I'm interested and it's a nice challenge to read.
If you like my content please give it a boost it helps so much.
Eth is looking very bullish, its an important change of direction with a double upward take as you can see, its jumped 10% in the past month. That's significant.
If you are wondering if it's too late, it's not, its still 50% than beginning of year. Ethereum is becoming more and more popular with gaming, and viable transanctions. Much more than bitcoin. You have to be in the industry to understand it. It's the best P2P ever built. It's not gonig anywhere, it's here to stay. In my opinion its a solid investment.

Ethereum - weekly planIn this idea I marked the important levels for this week and considered a few scenarios of price performance
At the moment the price is near an important level, in case of updating the local bottom I expect further decline
Write a comment with your coins & hit the like button and I will make an analysis for you
The author's opinion may differ from yours,
Consider your risks.
Wish you successful trades! MURA

Ethereum (ETH) Day Trade Setup – 05/05/2025 - 02:40 AMTime Frame: 30-Minute Chart
Current Observation: Price showing weakness around the $1840 resistance level.
📉 Trade Idea: Short Setup
Entry: $1840
Stop Loss: $1855
Target: $1796
📝 Analysis:
Price action is struggling to hold above $1840, forming lower highs on the 30-minute chart. Momentum indicators suggest weakening bullish pressure, supporting a short bias toward $1796.
⚠️ Disclaimer:
This is not financial advice. All trade setups are shared for educational and informational purposes only. Always conduct your own research and consult with a licensed financial advisor before making any investment or trading decisions. Trading involves significant risk and may result in the loss of your capital.

Bullish momentum to extend?Ethereum (ETH/USD) is reacting off the pivot and could bounce to the overlap resistance that aligns with the 78.6% Fibonacci retracement.
Pivot:1,833.07
1st Support: 1,738.55
1st Resistance: 1,949.39
Risk Warning:
Trading Forex and CFDs carries a high level of risk to your capital and you should only trade with money you can afford to lose. Trading Forex and CFDs may not be suitable for all investors, so please ensure that you fully understand the risks involved and seek independent advice if necessary.
Disclaimer:
The above opinions given constitute general market commentary, and do not constitute the opinion or advice of IC Markets or any form of personal or investment advice.
Any opinions, news, research, analyses, prices, other information, or links to third-party sites contained on this website are provided on an "as-is" basis, are intended only to be informative, is not an advice nor a recommendation, nor research, or a record of our trading prices, or an offer of, or solicitation for a transaction in any financial instrument and thus should not be treated as such. The information provided does not involve any specific investment objectives, financial situation and needs of any specific person who may receive it. Please be aware, that past performance is not a reliable indicator of future performance and/or results. Past Performance or Forward-looking scenarios based upon the reasonable beliefs of the third-party provider are not a guarantee of future performance. Actual results may differ materially from those anticipated in forward-looking or past performance statements. IC Markets makes no representation or warranty and assumes no liability as to the accuracy or completeness of the information provided, nor any loss arising from any investment based on a recommendation, forecast or any information supplied by any third-party.

Can ETH Really Hit $80K? Adoption Trends and Technicals Say, YESEthereum’s adoption is booming in 2025, with over 50 major enterprises building on its network, a 21.7% global crypto ownership share, and $102 billion in stablecoin volume. Daily transactions hit $13.74 billion, and new addresses doubled to 200,000 in January 2025. The 3W chart shows ETH at $1,859.1, oversold (Stochastic RSI -101.5), hinting at a potential bounce. A 43x increase to $80K would need a $40 trillion market cap—steep but not impossible given historical 400x growth (2016–2021). Layer 2 scaling and ETF inflows support the bull case, but competition from Solana and privacy concerns could hinder the journey. What do you think? Or am I just insane?


Ethereum H4 | Falling toward a multi-swing-low supportEthereum (ETH/USD) is falling towards a multi-swing-low support and could potentially bounce off this level to climb higher.
Buy entry is at 1,732.25 which is a multi-swing-low support that aligns close to the 23.6% Fibonacci retracement.
Stop loss is at 1,650.00 which is a level that lies underneath a pullback support and the 38.2% Fibonacci retracement.
Take profit is at 1,938.37 which is an overlap resistance that aligns with the 78.6% Fibonacci retracement.
High Risk Investment Warning
Trading Forex/CFDs on margin carries a high level of risk and may not be suitable for all investors. Leverage can work against you.
Stratos Markets Limited (tradu.com):
CFDs are complex instruments and come with a high risk of losing money rapidly due to leverage. 63% of retail investor accounts lose money when trading CFDs with this provider. You should consider whether you understand how CFDs work and whether you can afford to take the high risk of losing your money.
Stratos Europe Ltd (tradu.com):
CFDs are complex instruments and come with a high risk of losing money rapidly due to leverage. 63% of retail investor accounts lose money when trading CFDs with this provider. You should consider whether you understand how CFDs work and whether you can afford to take the high risk of losing your money.
Stratos Global LLC (tradu.com):
Losses can exceed deposits.
Please be advised that the information presented on TradingView is provided to Tradu (‘Company’, ‘we’) by a third-party provider (‘TFA Global Pte Ltd’). Please be reminded that you are solely responsible for the trading decisions on your account. There is a very high degree of risk involved in trading. Any information and/or content is intended entirely for research, educational and informational purposes only and does not constitute investment or consultation advice or investment strategy. The information is not tailored to the investment needs of any specific person and therefore does not involve a consideration of any of the investment objectives, financial situation or needs of any viewer that may receive it. Kindly also note that past performance is not a reliable indicator of future results. Actual results may differ materially from those anticipated in forward-looking or past performance statements. We assume no liability as to the accuracy or completeness of any of the information and/or content provided herein and the Company cannot be held responsible for any omission, mistake nor for any loss or damage including without limitation to any loss of profit which may arise from reliance on any information supplied by TFA Global Pte Ltd.
The speaker(s) is neither an employee, agent nor representative of Tradu and is therefore acting independently. The opinions given are their own, constitute general market commentary, and do not constitute the opinion or advice of Tradu or any form of personal or investment advice. Tradu neither endorses nor guarantees offerings of third-party speakers, nor is Tradu responsible for the content, veracity or opinions of third-party speakers, presenters or participants.


ETHUSD analysisAs we can see in M15 chart after IDM (X) taken out price fails to make BOS (Break of structure) . So, we can say swing high become stronger than the swing low. Therefore there is a high probability to break the low. Hence we can create short position after taken out the inducement.

ETHUSD Stuck Below 1,830 – Bulls Losing Steam or Gearing Up?Ethereum remains range-bound below the 1,830 🔼 resistance after a failed bullish breakout attempt. Price has been consolidating between the 1,500 🔽 support and the 1,830 🔼 resistance for weeks. A breakout from either level will determine the next directional move.
Support at: 1,500 🔽
Resistance at: 1,830 🔼, 2,100 🔼, 2,530 🔼, 3,040 🔼, 4,036 🔼
Bias:
🔼 Bullish: Break and close above 1,830 could open room toward 2,100 and 2,530.
🔽 Bearish: Rejection at 1,830 or drop below 1,700 could push price back toward 1,500.
📛 Disclaimer: This is not financial advice. Trade at your own risk.

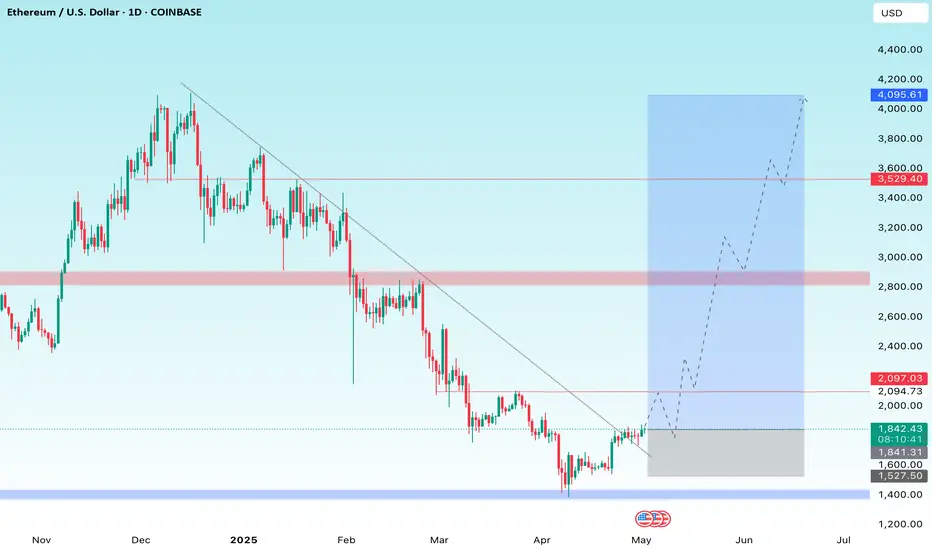
Ethereum (ETH) Breaks Descending Trendline – Eyeing $4,000?Ethereum (ETH) Breaks Descending Trendline – Eyeing $4,000?
Description:
Ethereum has officially broken out of a long-term descending trendline on the daily timeframe, signaling a potential trend reversal. After holding support near the $1,500–$1,600 zone, ETH has started forming higher lows and is now aiming for key resistance zones. A bullish scenario could see price rally toward $2,800, with a possible extension toward the $3,500–$4,000 zone if momentum continues.
The breakout is supported by strong price structure and rejection from major demand zones, making this a chart worth watching closely. Will the bulls take control and drive ETH back to 2024 highs?
Technical Levels to Watch:
• Support: $1,840 / $1,600
• Resistance: $2,100 / $2,800 / $3,530 / $4,095
Follow for more updates as this setup develops. Let’s see how Ethereum reacts to this breakout!
Stay tuned for live updates & detailed trade setups. Drop your thoughts below and don’t forget to follow for more high-probability analyses!
ETHUSD Will Go Up! Long!
Here is our detailed technical review for ETHUSD.
Time Frame: 12h
Current Trend: Bullish
Sentiment: Oversold (based on 7-period RSI)
Forecast: Bullish
The market is trading around a solid horizontal structure 1,848.90.
The above observations make me that the market will inevitably achieve 2,055.37 level.
P.S
We determine oversold/overbought condition with RSI indicator.
When it drops below 30 - the market is considered to be oversold.
When it bounces above 70 - the market is considered to be overbought.
Disclosure: I am part of Trade Nation's Influencer program and receive a monthly fee for using their TradingView charts in my analysis.
Like and subscribe and comment my ideas if you enjoy them!
