[WAITING] ETHUSDT - Binance | What now?Welcome,
- Status: Neutral
- ETH Stil Consolidation, waiting signal for validation entry
Keep wait..
Lets see..
ETHEREUM trade ideas

EthereumETHUSD
- Completed " 123 " Impulsive Waves
- Break of Structure
- Demand Zone
- Ascending Triangle in Short Time Frame
- Order Block

Bearish drop?Ethereum (ETH/USD) is reacting off the pivot and could drop to the 50% Fibonacci support.
Pivot: 1,833.07
1st Support: 1,686.37
1st Resistance: 1,949.39
Risk Warning:
Trading Forex and CFDs carries a high level of risk to your capital and you should only trade with money you can afford to lose. Trading Forex and CFDs may not be suitable for all investors, so please ensure that you fully understand the risks involved and seek independent advice if necessary.
Disclaimer:
The above opinions given constitute general market commentary, and do not constitute the opinion or advice of IC Markets or any form of personal or investment advice.
Any opinions, news, research, analyses, prices, other information, or links to third-party sites contained on this website are provided on an "as-is" basis, are intended only to be informative, is not an advice nor a recommendation, nor research, or a record of our trading prices, or an offer of, or solicitation for a transaction in any financial instrument and thus should not be treated as such. The information provided does not involve any specific investment objectives, financial situation and needs of any specific person who may receive it. Please be aware, that past performance is not a reliable indicator of future performance and/or results. Past Performance or Forward-looking scenarios based upon the reasonable beliefs of the third-party provider are not a guarantee of future performance. Actual results may differ materially from those anticipated in forward-looking or past performance statements. IC Markets makes no representation or warranty and assumes no liability as to the accuracy or completeness of the information provided, nor any loss arising from any investment based on a recommendation, forecast or any information supplied by any third-party.

ETHUSD-SELL strategy 6 hourly chart KAGIIt feels we are bit overextended. We have had a nice run up from $ 1,550 area and now we are on top side of the expected outcome short-term. The channel top is clearly observed and we have an overbought state, suggesting we should a move back towards $ 1,600 area.
Strategy SELL @ $ 1,790-$ 1,825 and take profit near $ 1,625 for now.

ETHEREUM, the big catch-up has finally begun!Introduction: In our previous TradingView analyses, we defended the bullish recovery of the crypto market since the beginning of April, particularly for the bitcoin price. The latter seems to be positively correlated with the global liquidity trend (you can reread all our latest crypto analyses in our analysis history directly from the main page of our TradingView profile).
In this new analysis, we discuss the return of Ethereum's outperformance of Bitcoin.
1) ETH/USD bullish cycle: what are the theoretical price targets highlighted by technical analysis of the financial markets?
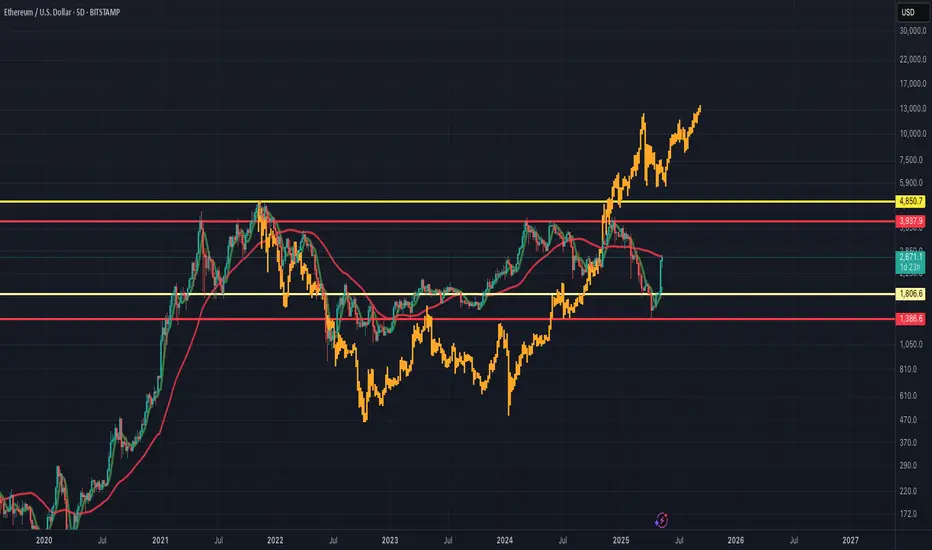
The current bullish cycle for ETH/USD began in the summer of 2022, with prices rebounding from the all-time high of the penultimate cycle, which peaked at $1150 in January 2018. A chartist base for a bullish reversal had developed between July and November 2022, before the uptrend began shortly after the FTX bankruptcy.
A well-constructed uptrend then took place until March 2024, with an intermediate high reached at $4,000, a resistance that three times produced a bearish rejection effect. The ETH/USD rate finally rallied back above major support at $1150/1350 and now appears to have resumed a bullish bottom trajectory in alignment with the bitcoin price.
2) Ethereum VS Bitcoin, the great catch-up may have begun
The question investors are now asking is whether or not Ethereum is in a position to outperform bitcoin in the coming weeks. To answer this question, we need to look at both fundamental and technical aspects.
On the fundamental level, the very recent “Pectra” update considerably improves the functioning of the Ethereum blockchain, notably by reducing transaction costs. This update could be the fundamental element underpinning a return to Ethereum's outperformance of Bitcoin.
In terms of technical analysis, it is the ETH/BTC ratio that helps determine Ethereum's cycles of outperformance and underperformance against Bitcoin. Technical analysis of the ETH/BTC ratio highlights the presence of long-term chart support, which seems to have enabled a clear rebound in the ETH/BTC rate.
Consequently, if this major support remains preserved over the coming weeks, then yes, it's becoming increasingly likely that ETH/USD will do better than BTC/USD over the next few weeks on the crypto-currency market. This market view would be invalidated in the event of a breakout of the major support mentioned and which is represented on the chart below.
DISCLAIMER:
This content is intended for individuals who are familiar with financial markets and instruments and is for information purposes only. The presented idea (including market commentary, market data and observations) is not a work product of any research department of Swissquote or its affiliates. This material is intended to highlight market action and does not constitute investment, legal or tax advice. If you are a retail investor or lack experience in trading complex financial products, it is advisable to seek professional advice from licensed advisor before making any financial decisions.
This content is not intended to manipulate the market or encourage any specific financial behavior.
Swissquote makes no representation or warranty as to the quality, completeness, accuracy, comprehensiveness or non-infringement of such content. The views expressed are those of the consultant and are provided for educational purposes only. Any information provided relating to a product or market should not be construed as recommending an investment strategy or transaction. Past performance is not a guarantee of future results.
Swissquote and its employees and representatives shall in no event be held liable for any damages or losses arising directly or indirectly from decisions made on the basis of this content.
The use of any third-party brands or trademarks is for information only and does not imply endorsement by Swissquote, or that the trademark owner has authorised Swissquote to promote its products or services.
Swissquote is the marketing brand for the activities of Swissquote Bank Ltd (Switzerland) regulated by FINMA, Swissquote Capital Markets Limited regulated by CySEC (Cyprus), Swissquote Bank Europe SA (Luxembourg) regulated by the CSSF, Swissquote Ltd (UK) regulated by the FCA, Swissquote Financial Services (Malta) Ltd regulated by the Malta Financial Services Authority, Swissquote MEA Ltd. (UAE) regulated by the Dubai Financial Services Authority, Swissquote Pte Ltd (Singapore) regulated by the Monetary Authority of Singapore, Swissquote Asia Limited (Hong Kong) licensed by the Hong Kong Securities and Futures Commission (SFC) and Swissquote South Africa (Pty) Ltd supervised by the FSCA.
Products and services of Swissquote are only intended for those permitted to receive them under local law.
All investments carry a degree of risk. The risk of loss in trading or holding financial instruments can be substantial. The value of financial instruments, including but not limited to stocks, bonds, cryptocurrencies, and other assets, can fluctuate both upwards and downwards. There is a significant risk of financial loss when buying, selling, holding, staking, or investing in these instruments. SQBE makes no recommendations regarding any specific investment, transaction, or the use of any particular investment strategy.
CFDs are complex instruments and come with a high risk of losing money rapidly due to leverage. The vast majority of retail client accounts suffer capital losses when trading in CFDs. You should consider whether you understand how CFDs work and whether you can afford to take the high risk of losing your money.
Digital Assets are unregulated in most countries and consumer protection rules may not apply. As highly volatile speculative investments, Digital Assets are not suitable for investors without a high-risk tolerance. Make sure you understand each Digital Asset before you trade.
Cryptocurrencies are not considered legal tender in some jurisdictions and are subject to regulatory uncertainties.
The use of Internet-based systems can involve high risks, including, but not limited to, fraud, cyber-attacks, network and communication failures, as well as identity theft and phishing attacks related to crypto-assets.

ETHUSD-SELL strategy 6 hourly chart We have had minor corrections, and like a bullet train moving beyond the previous highs.
Its very overbought on all time frames, and we apply wave analysis (estimated) we may understand that a correction is overdue as well. The A corrective wave may be somehwre 2,350 area. Overall I still see $ 2,100 zone to be reached over time.
Strategy SELL current $ 2,650 - 2,700 and take profit first near $ 2,375 area.

EthusdtThis move from the lows has been incredibly strong
Probably test the highs in coming months..
Successful pectra upgrade
Might see aths

ETHWonder will Eth catch back up to the last cycle.Getting tricky here at this point sure after this FED meeting we will see a clear picture of price action.

ETHUSD Multi Time Frame Trend Analysis, Profit Surging InsightsDaily Chart (1D) Overview
The daily chart reflects a powerful bullish breakout, where ETHUSD surged past prior resistance levels, now potentially turning into support. Key observations:
Support Zones:
The $2,300 to $2,400 zone has emerged as a strong demand area. This zone was previously resistance and has now flipped into support after the breakout.
A deeper retracement could potentially revisit the $1,750 to $1,850 demand area, though that would suggest a breakdown of current bullish momentum.
Resistance Zones:
The price is currently testing minor resistance around $2,600 and $2,650, with historical supply and reaction zones visible from previous consolidation.
A broader supply zone exists between $2,800 to $3,400, marked in red, which could be the next major target area if the bulls maintain momentum.
Structure:
ETH formed a higher low in late April followed by a higher high in early May, confirming a trend reversal from the earlier bearish structure.
The clean breakout from consolidation signals a fresh bullish leg, with increasing volume and momentum indicators likely aligning with upward bias.
Trend Direction: Bullish on both Daily and 4H
✅ Market Structure: Higher highs and higher lows
✅ Key Short-Term Support: $2,350 to $2,450
✅ Key Resistance Zones: $2,620 to $2,650 → $2,800 → $3,400
✅ Upside Targets:
1. Short-Term: $2,650 → $2,800
2. Medium-Term: $3,400 → $4,108
✅ Potential Retracement Levels:
3. Shallow: $2,420
4. Deeper: $2,200 and $1,850
If the price holds above $2,400, the bullish outlook remains intact, with increasing likelihood of testing higher resistance levels. However, a sustained move below $2,300 could trigger deeper retracements.

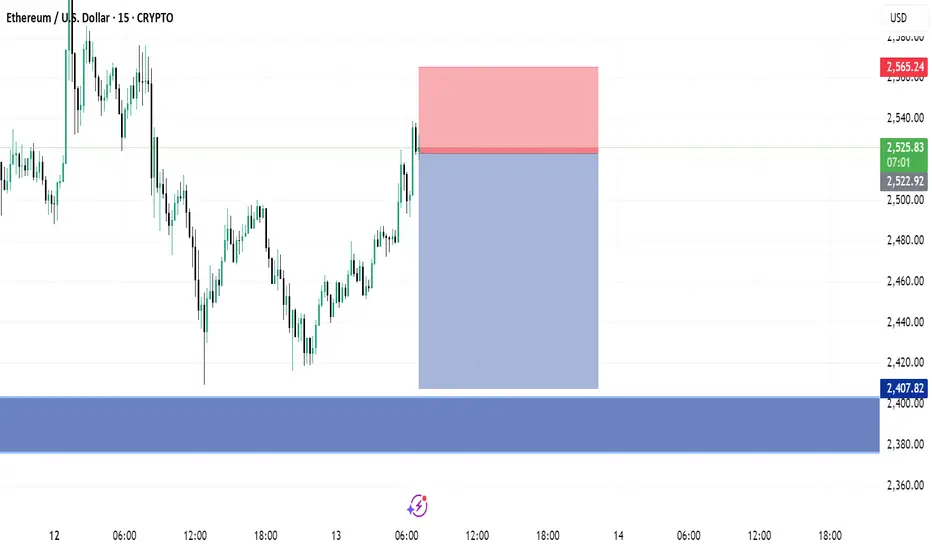
ETH is moving within the 2,300.00 - 2,600.00 range👀 Possible scenario:
Ethereum has surged over 50% in the past month, breaking above $2,400 for the first time since March and outpacing Bitcoin’s gains. Analysts are calling it the top crypto to watch, fueled by renewed investor confidence and strong on-chain activity. Currently trading near $2,500, ETH is benefiting from renewed market confidence and strong on-chain activity. Data from CryptoQuant shows stakers are back in profit, signaling increased confidence in Ethereum’s long-term outlook and network stability.
Ethereum remains the foundation for real-world applications and stablecoins, and is the only altcoin legally classified as a commodity—boosting institutional trust. A potential pause in the Fed’s tightening later this year could provide an additional boost to ETH’s rally. With growing momentum and increased staking, Ethereum is steadily closing in on its all-time high of $4,878.
✅ Support and Resistance Levels
Support level is now located at 2,300.00.
Now, the resistance level is located at 2,600.00.

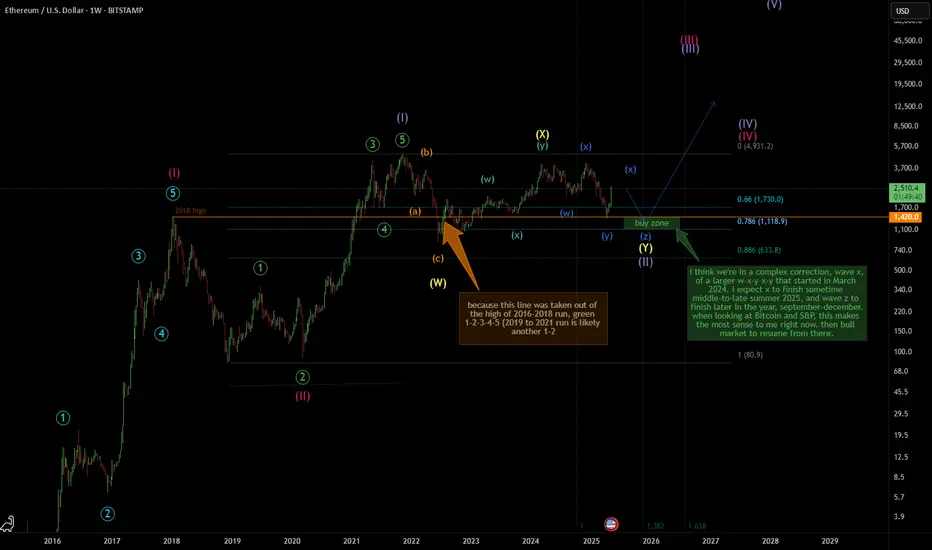
Macro-bullish Ethereum Elliott wave count (still in correction)Local structures (not shown), in confluence with Bitcoin and S&P counts, make it more likely that we're in the x wave of w-x-y-x-z that started March 2024. If it plays out the triple zigzag, I expect the move to play out till end of 2025, possibly middle of Fall to end of the year.
Time-wise, that'll put it at around 1.382 Fibonacci extension from the 2019-2022 run, which is a good place to finish.
Good news is that, with an extended correction (crypto markets have typically seen short and fast corrections), and a double 1-2's since 2015 market, I expect the next bullish wave push to be aggressive and large.
However, with the nature of complex corrective structure of w-x-y's, current w-x-y-x-z can always extend longer by adding another a-b-c or w-x-y to the end of its tail, so 1.618 Fibonacci extension at August 2026 is a possibility.
ETH Short for nowETH is preparing for a bullish now were at a pullback phase where we can find short position as this one until it hit the demand/support zone where we will see a reversal and then BOS on a bullish trend seeing ETH on new levels

Ethereum/USD pushing upIt's arise since morning....
It gained a push at 2377.709 level..where buyers are taking control since 11.am

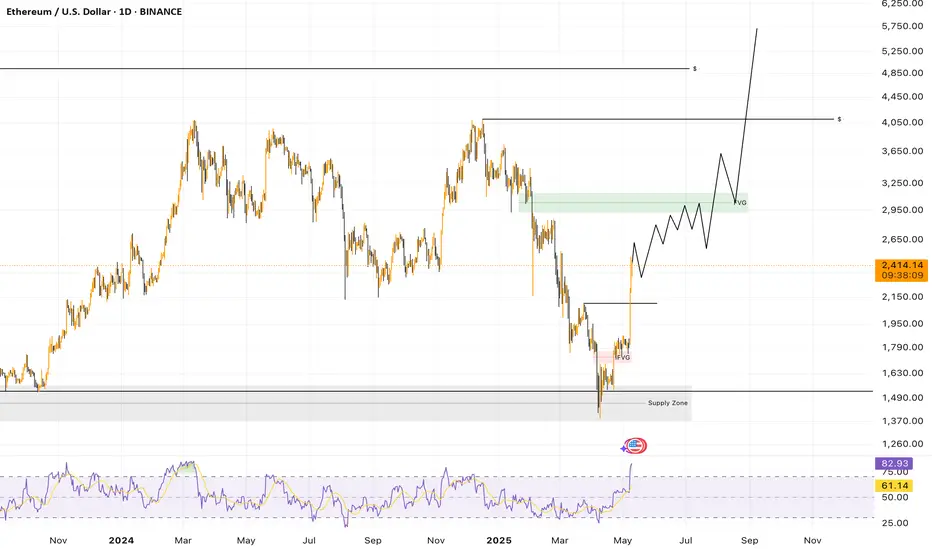
Ethereum (ETH/USD) – 1D Analysis
📈 Ethereum has likely entered a new bullish leg, supported by the recent Pectra upgrade, which significantly enhances the network's scalability and efficiency.
🚀 Just like in previous cycles, this phase could lead to an exponential move, potentially targeting the $4,500 to $6,000 range if momentum continues.
🔎 Key Technical Levels:
FVG around $2,900 - $3,100 acting as the first resistance area.
Major Supply Zone cleared, confirming a solid base around $1,500 - $1,700.
Mid-range target near $4,000 before testing previous ATH levels.
💥 As long as ETH holds above the FVG, the uptrend remains firmly in place, with the potential for a parabolic breakout as institutional interest grows.
⚠️ Risks:
Potential profit-taking as we approach previous highs.
Macro risks, including potential regulatory pressure and economic headwinds.
👉 For now, the path of least resistance remains to the upside, with higher lows and higher highs confirming a bull market structure.
#ETH/USDT#ETH
The price is moving in a descending channel on the 1-hour frame and is adhering to it well and is heading to break it strongly upwards and retest it
We have a rebound from the lower limit of the descending channel, this support is at a price of 2000
We have a downtrend on the RSI indicator that is about to break and retest, which supports the rise
We have a trend to stabilize above the moving average 100
Entry price 2117
First target 2211
Second target 2304
Third target 2433

Careful with your Crypto BuysWinter is comming
A retracement 2ullback is comming
levels in the chart, nothing goes up forever

ETHUSD INTRADAY bullish breakout supported at 2,190The ETH/USD pair maintains a bullish overall sentiment, underpinned by a sustained upward trend.
Key Levels:
Support: 2,190 (primary), followed by 2,123 and 2,046
Resistance: 2,625, with extended targets at 2,725 and 2,850
A corrective dip toward the key support zone at 2,190 could offer a bullish rebound opportunity. A successful bounce from this level would reinforce the uptrend and pave the way for a test of the 2,625 resistance. A breakout above this level may open the door to further gains toward 2,725 and 2,850 over the longer term.
Conversely, a decisive break and daily close below 2,190 would invalidate the bullish setup, potentially triggering a deeper pullback toward the 2,123 and 2,046 support levels.
Conclusion:
While the broader trend remains bullish, ETH/USD is currently consolidating. Traders should watch the 2,190 support closely—its defence may confirm trend continuation, while a breakdown could signal a short-term bearish reversal.
This communication is for informational purposes only and should not be viewed as any form of recommendation as to a particular course of action or as investment advice. It is not intended as an offer or solicitation for the purchase or sale of any financial instrument or as an official confirmation of any transaction. Opinions, estimates and assumptions expressed herein are made as of the date of this communication and are subject to change without notice. This communication has been prepared based upon information, including market prices, data and other information, believed to be reliable; however, Trade Nation does not warrant its completeness or accuracy. All market prices and market data contained in or attached to this communication are indicative and subject to change without notice.

$ETH - Ethereum enters buy zoneHey traders!
How is your portfolio doing? Trump is shaking us!
After all these months in 2025 I've tried to project a new scenario (bullish/bearish) that clarifies our next outlook.
Not an easy job. As you see day by day, markets are in high volatility due to trade war and (not trying to be pesimistic) could be worse.
However, In my opinion Ethereum (and altcoin markets) are entering into a golden opportunity. that has to be taken 100%. Don't know where is the bottom for CRYPTOCAP:ETH on a short scenario. But, what I can certainly say is that won't fall as a stone for too long.
Ranges between 1400 - 2000 USD are gold prices to make progressives buys. Although it could fall even more ( 900 - 1200 USD) I think this is a high Risk reward buy.
But, timing is not on time. Shouldn't I sell, expecting a bear market( you know Halving and Posthalving ideas). Times have changed as the macro scenario has not been the same as the previous bullruns.
So, it's time to accumulate and expect a possible expansion cycle in 2026.. That could lead Ethereum to prices never seen before. Yes, the range between 8.000 - 15.000 USD.
As I always say. Just my opinion. Stay safe!

add to the watchlist, after bullish wave of btc, eth is next2048-2440 Strong resistance levels, upbrake of the trend will pump etherium to the target. invalidation level is important it is half of the current price. patience will create gain opprtunity on this one.

massive breakoutGuys massive breakout
It's going to collect after ethereum news of so called halving
still 50% off from beginning of year

ETHUSD Long (UPDATE)The run is continuing on ETH.
CRYPTO seems to be on run across the board with BTC over $100K
